Introduction
To better assess any potential emission impacts from the 800 megawatt CPV Sentinel natural gas-powered electric generation facility to the Desert Hot Springs area, the South Coast Air Quality Management District (SCAQMD) has been operating an air pollution monitor directly downwind of the power plant since May 2014. The monitor measures levels of fine particulate matter (PM2.5) on a continuous basis, providing real-time hourly data.
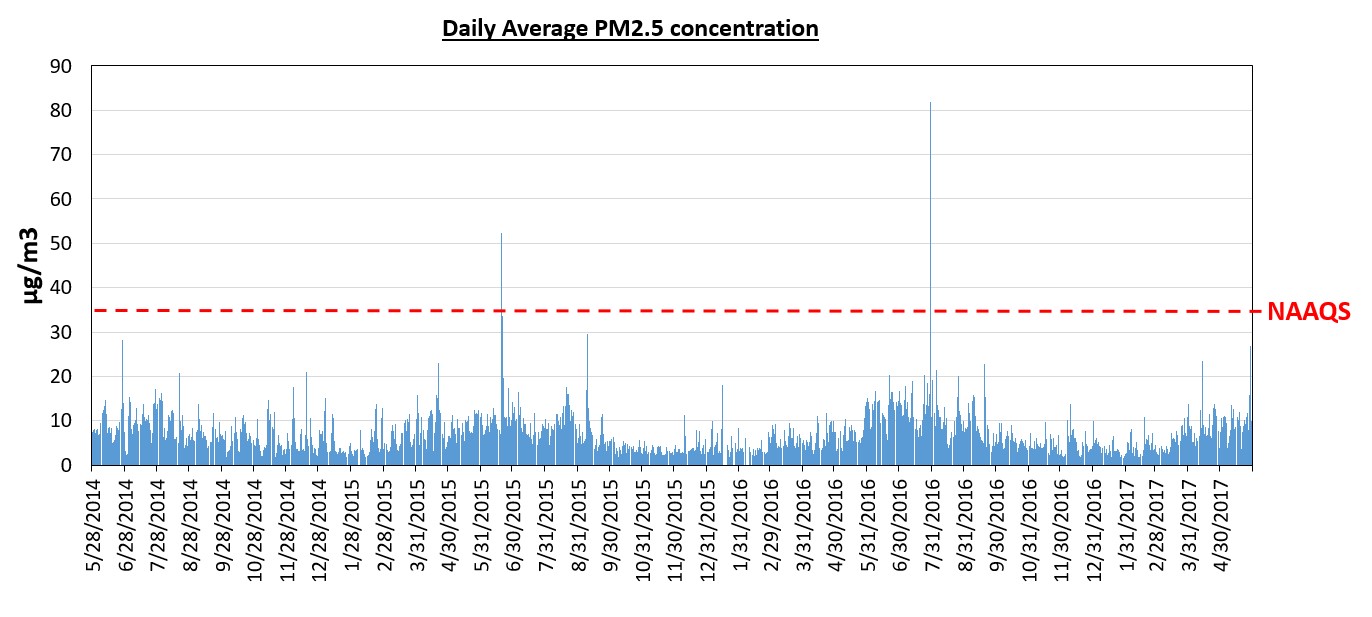
The figure below shows the 24-hr average concentration of PM2.5 at this monitoring site between May 2014 and May 2017. Overall, daily PM2.5 levels were comparable to those measured in other parts of the Coachella Valley with only two values exceeding the 24-hour PM2.5 National Ambient Air Quality Standard (NAAQS) of 35 µg/m3, on June 19, 2015 and July 30, 2016. The high PM2.5 values on both of these days were not correlated to power plant emissions, but were associated with windblown dust and sand that was transported into the Coachella Valley by outflows from thunderstorms over the desert southwest. These two days also had very high PM10 values throughout the Coachella Valley.

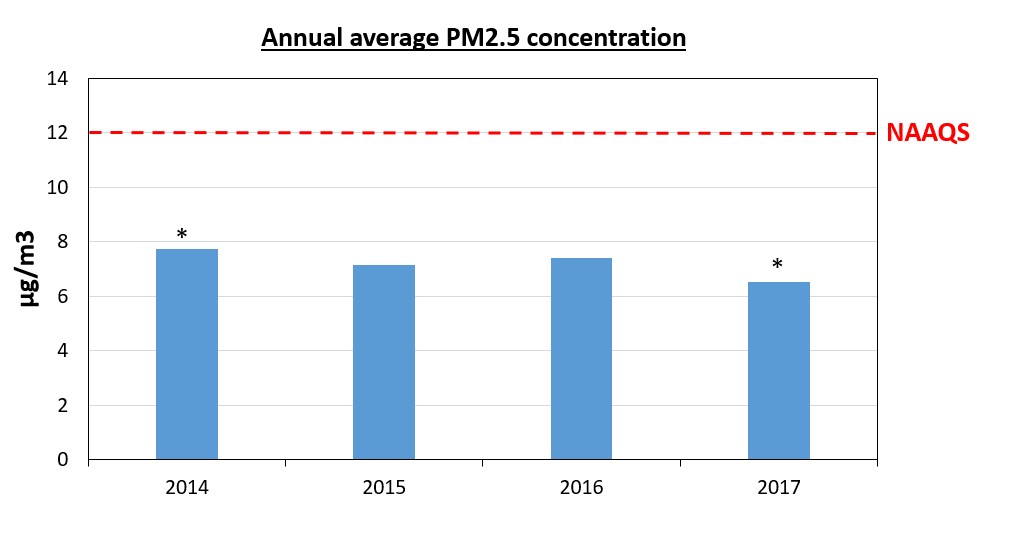
Annual averages of the measured PM2.5 concentrations are presented in the figure below and are well below the annual NAAQS for PM2.5 (12 µg/m3).

* The average values for 2014 and 2017 do not represent complete years.
It should be noted that an exceedance of the concentration level of a federal standard does not necessarily mean that the NAAQS was violated or that it would cause a nonattainment designation. The 24-hour PM2.5 NAAQS is the 3-year average of the annual 98th percentile of the daily maximum 1-hour average concentrations. The annual PM2.5 NAAQS (12 µg/m3) is the annual average concentration, averaged over three years and, according to this data, it was never exceeded during the study period.
Below are links to the data
Recent Hourly Data: Hourly PM2.5 (ug/m3) concentrations for the last 24 hours
Historical Data: Table of Past Hourly PM2.5 (ug/m3) concentrations updated weekly
CPV Sentinel Frequently Asked Questions (FAQ).
Disclaimer