Start searching for retail gas stations in your neighborhood.
Gas stations emit benzene, a known human carcinogen and are subject to SCAQMD Rule 461 - Gasoline Transfer and Dispensing (PDF, 90kb). Currently, there are approximately 3,140 retail gas stations in the Basin. An industry-wide risk assessment was performed for these retail gas stations using permitted emissions, dispersion modeling, and risk assessment procedures approved by the Governing Board in 2007. The procedures are briefly described next, but a more detailed discussion of the methods and results is available in the Health Risk Assessment for Gas Stations (PDF, 828kb).
The three key variables necessary to estimate cancer risks from retail gas stations are:
-
Gasoline throughput, usually expressed as million or thousand gallons per month or per year;
-
Distance to the nearest residential and commercial receptor, which are always assumed to be directly downwind of the facility; and
-
Location of the retail gas station, which is necessary for determining the appropriate meteorological site.
Permitted throughput was used instead of actual throughput for a couple of reasons. For one, it is a conservative approach since a facility’s actual throughput should always be less than or equal to its permitted throughput. More specifically, a selected comparison of actual and permitted annual permit levels indicated that on average actual gasoline throughput was about a third less than the permitted levels. Additionally, use of permitted throughput compensates for the fraction of retail gas stations that may be out of compliance at any given time. Benzene is the primary carcinogen and its emissions are proportional to the volume of gasoline sales at the facility.
Staff utilized throughput limits available in the SCAQMD’s permit database in addition to proximity to the nearest residential and occupational locations when available. For the older permits without a throughput condition, a monthly throughput value was calculated using each facility’s VOC emissions listed in the New Source Review (NSR) program. For facilities without reported receptor distances, staff calculated the distance from the facility to the nearest census block centroids which were obtained from a database developed for CARB’s Hotspots Analysis and Reporting Program (HARP) modeling system.
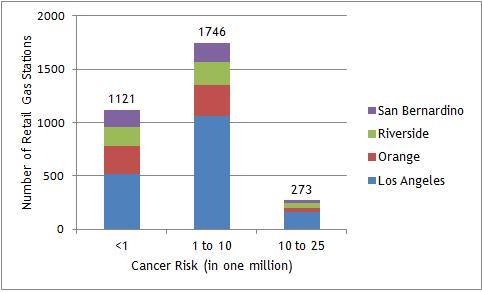
Dispersion modeling was performed for the 3,140 retail gasoline dispensing facilities using the U.S. EPA model called Industrial Source Complex (version 3) and relying on meteorological data collected at 35 stations in the Basin. The cancer risks from the stations were estimated using the procedures outlined above and the results are summarized in Figure 1. A more detailed discussion of the methods is available in the Health Risk Assessment for Gas Stations (PDF, 828kb) .
The facilities are distributed over the four counties as follows: 1,734 in Los Angeles county, 600 in Orange county, 439 in Riverside county, and 367 in San Bernardino county. Over 90 percent of the retail gas stations have risks less than 10 in a million. About nine percent of the stations have risks above ten in a million. About half of the facilities associated with these higher risks were established prior to the SCAQMD’s Rule 1401 which was adopted on June, 1990 and thus were not subject to its limits. Also, residential and commercial development over time has encroached upon many of the retail gas stations, bringing receptors closer, and thus increasing risks. As mentioned earlier, these risks are over-estimated since they are based on permit limits and not actual emissions. Also, the methods used here are conservative (i.e., may overestimate risks) since the nearest affected receptors are assumed to be directly downwind. It is important to bear in mind that the higher risks are associated with receptors in close proximity to the retail gas station. More specifically, risks decrease by nearly 90 percent as receptor distances increase from 25 meters to 100 meters.
Figure 1. Cancer risks distribution for retail gas stations.

Important Links: