Aeroqual
(S500-GSS)
 |
1650 |
tVOC (MOx) |
|
|
- |
- |
Lab
|
Aeroqual
(S500-PID)
 |
3120 |
tVOC (PID) |
|
|
0.98
(low ramp) |
220 to 480
(low ramp) |
Lab
|
Aeroqual
(S500-PID)
 |
3120 |
tVOC (PID) |
|
|
0.99
(high ramp) |
50 to 1170
(high ramp) |
Lab
|
SGS Galson
(SmartSense)
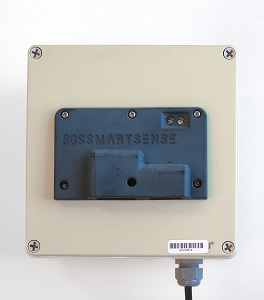 |
1972 |
tVOC (PID) |
|
|
0.97
(low ramp) |
330 to 450
(low ramp) |
Lab
|
SGS Galson
(SmartSense)
 |
1972 |
tVOC (PID) |
|
|
0.99
(high ramp) |
20 to 1080
(high ramp) |
Lab
|
SGS Galson
(SmartSense)
 |
1995 |
CO (EC) |
0.29 to 0.73 |
74.3 to 212.1 |
|
|
Field
|
SGS Galson
(SmartSense)
 |
1995 |
NO2 (EC) |
0.02 to 0.29 |
86.9 to 441.6 |
|
|
Field
|
SGS Galson
(SmartSense)
 |
1995 |
O3 (EC) |
0.59 to 0.71 |
11.5 to 16.2 |
|
|
Field
|
SGS Galson
(SmartSense)
 |
1995 |
PM1.0 |
0.86 to 0.90 |
2.0 to 2.7 |
|
|
Field
|
SGS Galson
(SmartSense)
 |
1995 |
PM2.5 |
0.86 to 0.88 |
2.6 to 3.3 |
|
|
Field
|
SGS Galson
(SmartSense)
 |
1995 |
PM10 |
0.57 to 0.60 |
9.9 to 15.4 |
|
|
Field
|
Fablab
(Smart Citizen
Kit v2.1)
 |
119 |
tVOC (MOx) |
|
|
0.69 to 0.73
(low ramp) |
410 to 430
(low ramp) |
Lab
|
Fablab
(Smart Citizen
Kit v2.1)
 |
119 |
tVOC (MOx) |
|
|
-
(high ramp) |
-
(high ramp) |
Lab
|
PurpleAir
(PA-II-FLEX VOC)
 |
289 |
tVOC (MOx) |
|
|
Negative Correlation
(low ramp) |
-
(low ramp)
|
Lab
|
PurpleAir
(PA-II-FLEX VOC)
 |
289 |
tVOC (MOx) |
|
|
0.40-0.60
(high ramp) |
-
(high ramp) |
Lab
|
Sensirion
(SGP40)
 |
80 |
tVOC (MOx) |
|
|
0.91
(low ramp) |
30 to 340
(low ramp) |
Lab
|
Sensirion
(SGP40)
 |
80 |
tVOC (MOx) |
|
|
0.01
(high ramp) |
5000
(high ramp) |
Lab
|
SENSIT
(SPOD Ion XF-PID)
 |
3213 |
tVOC (PID) |
|
|
0.99
(low ramp) |
150 to 260
(low ramp) |
Lab
|
SENSIT
(SPOD Ion XF-PID)
 |
3213 |
tVOC (PID) |
|
|
0.99
(high ramp) |
800 to 2200
(high ramp) |
Lab
|
Aeroqual
(AQY-R)
 |
5000 |
PM2.5 |
0.66 to 0.81 |
2.9 to 5.1 |
0.99 |
3.0 to 13.3 |
Field
Lab
|
Aeroqual
(AQY v0.5)
Discontinued
 |
3000 |
PM2.5 |
0.84 to 0.87 |
- |
0.99 |
28.8 to 36.0 |
Field
Lab
|
Aeroqual
(AQY v1.0)
 |
4000 |
PM2.5 |
0.76 to 0.81 |
4.2 to 5.3 |
0.99 |
5.4 to 15.1 |
Field
Lab
|
Aeroqual
(AQY v1.0)
 |
4000 |
PM10 |
0.56 to 0.68 |
35.4 to 38.8 |
- |
- |
Field
|
Aeroqual
(S500-PM)
 |
1490 |
PM2.5 |
0.46 to 0.67 |
4.4 to 6.2 |
0.99 |
11.9 to 32.4 |
Field
Lab
|
Aeroqual
(S500-PM)
 |
1490 |
PM10 |
0.15 to 0.24 |
13.5 to 18.0 |
- |
- |
Field
Lab
|
AethLabs
(microAeth)
 |
6500 |
BC |
0.79 to 0.94 |
- |
- |
- |
Field
|
Airly
 |
1000 |
PM1.0 |
0.79 to 0.89 |
4.2 to 5.3 |
- |
- |
Field
|
Airly
 |
1000 |
PM2.5 |
0.83 to 0.89 |
4.5 to 5.0 |
- |
- |
Field
|
Airly
 |
1000 |
PM10 |
0.34 to 0.37 |
19.3 to 19.7 |
- |
- |
Field
|
Air Quality Egg
(2018 Model)
 |
249 |
PM1.0 |
0.86 to 0.88 |
2.1 to 2.3 |
0.99 |
7.0 to 7.3 |
Field
Lab
|
Air Quality Egg
(2018 Model)
 |
249 |
PM2.5 |
0.84 to 0.85 |
4.4 to 5.3 |
0.99 |
6.1 to 6.6 |
Field
Lab
|
Air Quality Egg
(2018 Model)
 |
249 |
PM10 |
0.12 to 0.13 |
16.4 to 19.2 |
- |
- |
Field
Lab
|
Air Quality Egg
(Ver. 1)
 |
200 |
PM |
0 |
- |
- |
- |
Field
|
Air Quality Egg
(Ver. 2)
 |
240 |
PM2.5 |
0.79 to 0.85 |
- |
- |
- |
Field
|
Air Quality Egg
(Ver. 2)
 |
240 |
PM10 |
0.31 to 0.40 |
- |
- |
- |
Field
|
Air Quality Egg
(2022 Model)
 |
671 |
PM1.0 |
0.84 to 0.89 |
2.9 to 3.9 |
- |
- |
Field
Lab
|
Air Quality Egg
(2022 Model)
 |
671 |
PM2.5 |
0.88 to 0.90 |
6.0 to 7.1 |
0.99 |
5.0 to 8.0 |
Field
Lab
|
Air Quality Egg
(2022 Model)
 |
671 |
PM10 |
0.29 to 0.52 |
18.5 to 20.8 |
- |
- |
Field
Lab
|
AirThinx
(IAQ)
 |
1000 |
PM1.0 |
0.68 to 0.70 |
2.4 to 2.5 |
- |
- |
Field
|
AirThinx
(IAQ)
 |
1000 |
PM2.5 |
0.54 to 0.57 |
4.8 to 5.0 |
- |
- |
Field
|
AirThinx
(IAQ)
 |
1000 |
PM10 |
0.03 to 0.05 |
19.7 to 19.8 |
- |
- |
Field
|
Airviz Inc.
(Speck)
 |
150 |
PM2.5 |
0.32 |
- |
- |
- |
Field
|
Alphasense
(OPC-N2)
 |
310 |
PM1.0 |
0.63 to 0.82 |
- |
0.99 |
- |
Field
Lab
|
Alphasense
(OPC-N2)
 |
310 |
PM2.5 |
0.65 to 0.80 |
- |
0.99 |
- |
Field
Lab
|
Alphasense
(OPC-N2)
 |
310 |
PM10 |
0.45 to 0.57 |
- |
0.99 |
- |
Field
Lab
|
Alphasense
(OPC-N3)
 |
338 |
PM1.0 |
0.78 to 0.82 |
4.4 to 5.0 |
0.99 |
39.0 to 43.2 |
Field
Lab
|
Alphasense
(OPC-N3)
 |
338 |
PM2.5 |
0.52 to 0.67 |
7.1 to 9.2 |
0.99 |
40.3 to 46.9 |
Field
Lab
|
Alphasense
(OPC-N3)
 |
338 |
PM10 |
0.45 to 0.52 |
18.0 to 24.1 |
0.99 |
39.2 to 48.0 |
Field
Lab
|
Alphasense
(OPC-R2)
 |
435 |
PM1.0 |
0.77 to 0.87 |
7.8 to 11.8 |
- |
- |
Field
Lab
|
Alphasense
(OPC-R2)
 |
435 |
PM2.5 |
0.67 to 0.78 |
7.3 to 10.0 |
0.98 |
41.2 to 45.0 |
Field
Lab
|
Alphasense
(OPC-R2)
 |
435 |
PM10 |
0.69 to 0.86 |
7.8 to 15.4 |
0.98 to 0.99 |
18.5 to 27.9 |
Field
Lab
|
Applied Particle
Technology
(MINIMA)
 |
995 |
PM1.0 |
0.84 to 0.89 |
5.0 to 5.6 |
- |
- |
Field
Lab
|
Applied Particle
Technology
(MINIMA)
 |
995 |
PM2.5 |
0.86 to 0.89 |
5.8 to 6.5 |
0.99 |
5.0 to 8.1 |
Field
Lab
|
Applied Particle
Technology
(MINIMA)
 |
995 |
PM10 |
0.37 |
39.4 to 40.3 |
- |
- |
Field
Lab
|
AQMesh
(v3.0 PM, v5.1 Gas)
 |
7800 |
PM1.0 |
0.55 to 0.73 |
2.4 to 3.4 |
- |
- |
Field
|
AQMesh
(v3.0 PM, v5.1 Gas)
 |
7800 |
PM2.5 |
0.47 to 0.79 |
2.7 to 7.5 |
- |
- |
Field
|
AQMesh
(v3.0 PM, v5.1 Gas)
 |
7800 |
PM10 |
0.24 to 0.58 |
11.4 to 23.1 |
- |
- |
Field
|
AS-LUNG
(Air Quality Station)
 |
2199 |
PM1.0 |
0.42 to 0.88 |
3.2 to 7.3 |
- |
- |
Field
|
AS-LUNG
(Air Quality Station)
 |
2199 |
PM2.5 |
0.59 to 0.81 |
8.0 to 12.1 |
- |
- |
Field
|
AS-LUNG
(Air Quality Station)
 |
2199 |
PM10 |
0.15 to 0.23 |
18.6 to 21.2 |
- |
- |
Field
|
AS-LUNG
(Portable)
 |
1000 |
PM1.0 |
0.86 |
3.2 to 4.3 |
0.99 |
2.6 to 3.4 |
Field
Lab
|
AS-LUNG
(Portable)
 |
1000 |
PM2.5 |
0.78 |
6.8 to 8.2 |
0.99 |
12.8 to 13.5 |
Field
Lab
|
AS-LUNG
(Portable)
 |
1000 |
PM10 |
0.11 to 0.14 |
18.9 to 21.6 |
- |
- |
Field
Lab
|
Atmotube
(Pro)
 |
162 |
PM1.0 |
0.91 to 0.93 |
3.6 to 4.6 |
0.99 to 1.00 |
2.18 to 6.92 |
Field
Lab
|
Atmotube
(Pro)
 |
162 |
PM2.5 |
0.88 |
4.9 to 5.9 |
1.00 |
2.51 to 4.65 |
Field
Lab
|
Atmotube
(Pro)
 |
162 |
PM10 |
0.22 |
20.9 to 22.9 |
- |
- |
Field
Lab
|
Atmotube
(Pro)
 |
162 |
tVOC (MOx) |
|
|
0.95
(low ramp) |
270 to 280
(low ramp) |
Field
Lab
|
Atmotube
(Pro)
 |
162 |
tVOC (MOx) |
|
|
0.91 to 0.99
(high ramp) |
4840 to 5050
(high ramp) |
Field
Lab
|
Atmocube
 |
800 |
PM1.0 |
0.80 to 0.84 |
2.4 to 3.2 |
- |
- |
Field
|
Atmocube
 |
800 |
PM2.5 |
0.65 to 0.66 |
5.3 to 6.5 |
- |
- |
Field
|
Atmocube
 |
800 |
PM10 |
0.09 |
37.1 to 38.8 |
- |
- |
Field
|
A.U.G. Signals Ltd
(AirSENCE Standard
AS400X)
 |
4000 |
PM1.0 |
0.89 to 0.90 |
3.7 to 4.2 |
- |
- |
Field
|
A.U.G. Signals Ltd
(AirSENCE Standard
AS400X)
 |
4000 |
PM2.5 |
0.87 to 0.88 |
3.4 to 3.8 |
- |
- |
Field
|
A.U.G. Signals Ltd
(AirSENCE Standard
AS400X)
 |
4000 |
PM10 |
0.28 to 0.29 |
23.9 to 24.7 |
- |
- |
Field
|
Aurassure
(Trust Lite)
 |
525 |
PM1.0 |
0.84 to 0.85 |
2.0 to 2.3 |
- |
- |
Field
|
Aurassure
(Trust Lite)
 |
525 |
PM2.5 |
0.65 to 0.66 |
5.0 to 5.3 |
- |
- |
Field
|
Aurassure
(Trust Lite)
 |
525 |
PM10 |
0.07 to 0.08 |
36.9 to 37.3 |
- |
- |
Field
|
Blues Wireless
(Airnote)
 |
149 |
PM1.0 |
0.68 to 0.86 |
4.3 to 6.8 |
- |
- |
Field
|
Blues Wireless
(Airnote)
 |
149 |
PM2.5 |
0.67 to 0.75 |
4.4 to 7.1 |
- |
- |
Field
|
Blues Wireless
(Airnote)
 |
149 |
PM10 |
0.04 to 0.11 |
20.2 to 34.8 |
- |
- |
Field
|
Cair
 |
200 |
PM(1-2) |
0.43 to 0.51 |
- |
- |
- |
Field
|
Cair
 |
200 |
PM(3-10) |
0.39 to 0.51 |
- |
- |
- |
Field
|
Clarity
(Node)
 |
1300 |
PM2.5 |
0.73 to 0.76 |
3.0 to 3.4 |
0.99 |
9.3 to 10.6 |
Field
Lab
|
Davis Instruments
(Airlink)
 |
179 |
PM1.0 |
0.85 to 0.88 |
2.2 to 2.8 |
- |
- |
Field
Lab
|
Davis Instruments
(Airlink)
 |
179 |
PM2.5 |
0.74 to 0.81 |
4.9 to 5.9 |
0.99 |
4.3 to 6.6 |
Field
Lab
|
Davis Instruments
(Airlink)
 |
179 |
PM10 |
0.25 to 0.31 |
12.1 to 26.0 |
- |
- |
Field
Lab
|
Dylos
(DC1100 Pro)
 |
300 |
PM(0.5-2.5) |
0.65 to 0.85 |
4.2 |
0.89 |
- |
Field
Lab
|
Dylos
(DC1700-PM)
 |
475 |
PM2.5 |
0.58 to 0.68 |
24.3 to 28.5 |
0.95 |
198.3 to 209.4 |
Field
Lab
|
Dylos
(DC1700-PM)
 |
475 |
PM10 |
0.15 to 0.18 |
43.9 to 53.8 |
- |
- |
Field
Lab
|
Ecowitt
(WH415B)
 |
100 |
PM2.5 |
0.35 to 0.47 |
8.2 to 15.4 |
- |
- |
Field
|
Ecomesure
(EcomSmart)
 |
4550 |
PM1.0 |
0.63 to 0.74 |
5.6 to 7.1 |
0.92 |
1.6 to 3.7 |
Field
Lab
|
Ecomesure
(EcomSmart)
 |
4550 |
PM2.5 |
0.54 to 0.74 |
7.0 to 9.6 |
0.92 |
5.8 to 10.9 |
Field
Lab
|
Ecomesure
(EcomSmart)
 |
4550 |
PM10 |
0.08 to 0.25 |
16.7 to 20.3 |
- |
- |
Field
Lab
|
Edimax
(AirBox)
 |
249 |
PM2.5 |
0.61 to 0.87 |
4.4 to 5.5 |
- |
- |
Field
|
Edimax
(Edigreen Home)
 |
299 |
PM2.5 |
0.82 to 0.83 |
3.3 to 4.4 |
- |
- |
Field
|
Elitech
(Temtop LKC-1000S+)
 |
140 |
PM2.5 |
0.91 to 0.92 |
3.1 to 3.6 |
0.99 |
11.1 to 21.9 |
Field
Lab
|
Elitech
(Temtop LKC-1000S+)
 |
140 |
PM10 |
0.31 to 0.35 |
11.7 to 17.9 |
- |
- |
Field
Lab
|
Elitech
(Temtop M2000
2nd Generation)
 |
100 |
PM2.5 |
0.77 to 0.82 |
2.1 to 3.2 |
0.99 |
13.3 to 21.5 |
Field
Lab
|
Elitech
(Temtop M2000
2nd Generation)
 |
100 |
PM10 |
0.17 to 0.28 |
12.1 to 14.1 |
- |
- |
Field
Lab
|
Elitech
(Temtop P20)
 |
70 |
PM2.5 |
0.42 to 0.87 |
3.8 to 6.1 |
0.99 |
5.1 to 10.7 |
Field
Lab
|
Elitech
(Temtop PMD 351)
 |
960 |
PM1.0 |
0.68 to 0.75 |
2.4 to 3.8 |
- |
- |
Field
Lab
|
Elitech
(Temtop PMD 351)
 |
960 |
PM2.5 |
0.71 to 0.74 |
3.8 to 5.8 |
0.99 |
26.7 to 28.8 |
Field
Lab
|
Elitech
(Temtop PMD 351)
 |
960 |
PM10 |
0.27 to 0.46 |
9.1 to 18.6 |
- |
- |
Field
Lab
|
Fablab
(Smart Citizen
Kit v2.1)
 |
119 |
PM1.0 |
0.94 |
2.9 to 3.0 |
0.99 |
11.0 to 11.5 |
Field
Lab
|
Fablab
(Smart Citizen
Kit v2.1)
 |
119 |
PM2.5 |
0.76 to 0.77 |
8.3 to 10.7 |
0.99 |
11.8 to 14.5 |
Field
Lab
|
Fablab
(Smart Citizen
Kit v2.1)
 |
119 |
PM10 |
0.06 to 0.09 |
48.2 to 56.9 |
- |
- |
Field
Lab
|
Foobot
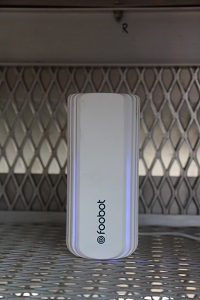 |
200 |
PM2.5 |
0.55 |
- |
- |
- |
Field
|
GGSensors
(TAM)
 |
7999 |
PM1.0 |
0.93 |
5.2 to 5.5 |
0.99 |
24.5 to 25.4 |
Field
Lab
|
GGSensors
(TAM)
 |
7999 |
PM2.5 |
0.92 |
5.4 to 5.7 |
0.99 |
21.4 to 22.3 |
Field
Lab
|
GGSensors
(TAM)
 |
7999 |
PM10 |
0.56 to 0.57 |
27.4 to 28.0 |
- |
- |
Field
|
HabitatMap
(AirBeam)
 |
200 |
PM2.5 |
0.65 to 0.70 |
15.6 to 29.0 |
0.87 |
203.5 to 271.9 |
Field
Lab
|
HabitatMap
(AirBeam2)
 |
250 |
PM1.0 |
|
2.9 to 3.0 |
0.99 |
16.5 to 18.1 |
Field
Lab
|
HabitatMap
(AirBeam2)
 |
250 |
PM2.5 |
0.63 to 0.75 |
3.3 to 3.7 |
0.99 |
11.3 to 13.5 |
Field
Lab
|
HabitatMap
(AirBeam2)
 |
250 |
PM10 |
0 |
25.8 to 28.0 |
- |
- |
Field
Lab
|
HabitatMap
(AirBeam3)
 |
249 |
PM1.0 |
0.95 to 0.97 |
1.3 to 2.6 |
0.99 |
1.5 to 5.7 |
Field
Lab
|
HabitatMap
(AirBeam3)
 |
249 |
PM2.5 |
0.81 to 0.90 |
3.6 to 5.3 |
0.99 |
2.6 to 11.6 |
Field
Lab
|
HabitatMap
(AirBeam3)
 |
249 |
PM10 |
0.19 to 0.25 |
20.4 to 26.8 |
- |
- |
Field
Lab
|
Hanvon
(Hanvon N1)
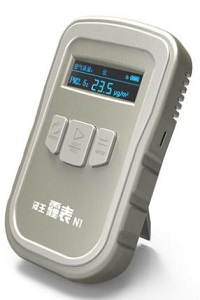 |
200 |
PM2.5 |
0.52 to 0.79 |
- |
- |
- |
Field
|
Igienair
(Zaack AQI)
 |
3000 |
PM1.0 |
0.78 to 0.83 |
6.3 to 6.5 |
- |
- |
Field
Lab
|
Igienair
(Zaack AQI)
 |
3000 |
PM2.5 |
0.80 to 0.82 |
3.8 to 4.2 |
0.97 |
5.3 to 23.0 |
Field
Lab
|
Igienair
(Zaack AQI)
 |
3000 |
PM10 |
0.69 to 0.71 |
14.4 to 23.9 |
0.99 |
6.0 to 13.1 |
Field
Lab
|
IQAir
(AirVisual Outdoor)
 |
289 |
PM1.0 |
0.52 to 0.64 |
4.5 to 5.6 |
- |
- |
Field
|
IQAir
(AirVisual Outdoor)
 |
289 |
PM2.5 |
0.54 to 0.65 |
4.4 to 6.0 |
- |
- |
Field
|
IQAir
(AirVisual Outdoor)
 |
289 |
PM10 |
0.39 to 0.60 |
10.5 to 14.4 |
- |
- |
Field
|
IQAir
(AirVisual Pro)
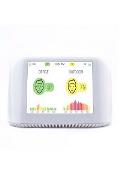 |
270 |
PM2.5 |
0.69 to 0.73 |
4.4 to 4.7 |
0.99 |
26.8 to 37.0 |
Field
Lab
|
IQAir
(AirVisual Pro)
 |
270 |
PM10 |
0.24 to 0.41 |
16.6 to 22.7 |
- |
- |
Field
Lab
|
IQAir
(AirVisual
Pro FW1.1683)
 |
270 |
PM2.5 |
0.63 to 0.81 |
3.5 to 5.5 |
0.99 |
1.8 to 10.8 |
Field
Lab
|
Kaiterra
(Laser Egg 2+)
 |
199 |
PM2.5 |
0.81 to 0.85 |
3.3 to 4.0 |
0.99 |
15.2 to 23.3 |
Field
Lab
|
Kaiterra
(Laser Egg 2+)
 |
199 |
PM10 |
0.17 to 0.25 |
8.0 to 17.3 |
- |
- |
Field
Lab
|
Kunak
(Air A10)
 |
3000 |
PM1.0 |
- |
- |
0.99 |
10.4 to 17.1 |
Field
Lab
|
Kunak
(Air A10)
 |
3000 |
PM2.5 |
0.69 to 0.75 |
5.4 to 6.4 |
0.99 |
4.3 to 14.4 |
Field
Lab
|
Kunak
(Air A10)
 |
3000 |
PM10 |
0.60 to 0.68 |
18.7 to 21.9 |
0.99 |
8.9 to 23.5 |
Field
Lab
|
Kunak
(Air Lite)
 |
5033 |
PM1.0 |
0.76 to 0.79 |
2.6 to 3.8 |
- |
- |
Field
|
Kunak
(Air Lite)
 |
5033 |
PM2.5 |
0.88 to 0.90 |
2.1 to 2.8 |
- |
- |
Field
|
Kunak
(Air Lite)
 |
5033 |
PM10 |
0.61 to 0.62 |
16.7 to 18.2 |
- |
- |
Field
|
Kunak
(Air Pro)
 |
8500 |
PM1.0 |
0.85 to 0.86 |
1.9 to 2.0 |
- |
- |
Field
|
Kunak
(Air Pro)
 |
8500 |
PM2.5 |
0.86 to 0.87 |
2.4 to 2.5 |
- |
- |
Field
|
Kunak
(Air Pro)
 |
8500 |
PM10 |
0.66 to 0.67 |
9.2 to 11.1 |
- |
- |
Field
|
Liveable Cities
(SLX-PM)
 |
954 |
PM2.5 |
0.79 to 0.83 |
6.4 to 9.1 |
- |
- |
Field
|
Liveable Cities
(SLX-PM)
 |
954 |
PM10 |
0.71 to 0.77 |
11.9 to 18.1 |
- |
- |
Field
|
Lunar Outpost
(Canary-S)
 |
1070 |
PM2.5 |
0.83 |
3.3 to 3.8 |
- |
- |
Field
|
Lunar Outpost
(Canary-S)
 |
1070 |
PM10 |
0.14 |
27.4 to 28.6 |
- |
- |
Field
|
Magnasci SRL
(uRADMonitor A3 HW105)
 |
500 |
PM1.0 |
0.81 to 0.85 |
4.0 to 5.2 |
- |
- |
Field
|
Magnasci SRL
(uRADMonitor A3 HW105)
 |
500 |
PM2.5 |
0.72 to 0.81 |
5.2 to 8.9 |
- |
- |
Field
|
Magnasci SRL
(uRADMonitor A3 HW105)
 |
500 |
PM10 |
0.15 to 0.38 |
20.3 to 29.1 |
- |
- |
Field
|
Magnasci SRL
(uRADMonitor
INDUSTRIAL HW103)
 |
1300 |
PM1.0 |
0.74 to 0.83 |
2.7 to 3.7 |
- |
- |
Field
|
Magnasci SRL
(uRADMonitor
INDUSTRIAL HW103)
 |
1300 |
PM2.5 |
0.70 to 0.78 |
4.1 to 8.1 |
- |
- |
Field
|
Magnasci SRL
(uRADMonitor
INDUSTRIAL HW103)
 |
1300 |
PM10 |
0.13 to 0.34 |
18.1 to 25.7 |
- |
- |
Field
|
Magnasci SRL
(uRADMonitor
SMOGGIE-PM v1.101)
 |
110 |
PM1.0 |
0.84 to 0.86 |
4.8 to 5.6 |
0.99 |
25.3 to 26.8 |
Field
Lab
|
Magnasci SRL
(uRADMonitor
SMOGGIE-PM v1.101)
 |
110 |
PM2.5 |
0.60 to 0.81 |
2.1 to 2.8 |
0.99 |
19.5 to 22.9 |
Field
Lab
|
Magnasci SRL
(uRADMonitor
SMOGGIE-PM v1.101)
 |
110 |
PM10 |
0.03 to 0.06 |
17.5 to 25.2 |
- |
- |
Field
Lab
|
Met One
(C-12)
 |
3000 |
BC |
0.66 to 0.75 |
0.10 to 0.13 |
- |
- |
Field
|
Met One
(E-Sampler)
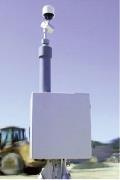 |
5500 |
PM1.0 |
- |
- |
- |
- |
Field
|
Met One
(E-Sampler)
 |
5500 |
PM2.5 |
0.55 to 0.62 |
10.9 to 15.2 |
- |
- |
Field
|
Met One
(E-Sampler)
 |
5500 |
PM10 |
- |
- |
- |
- |
Field
|
Met One
(E-Sampler)
 |
5500 |
TSP |
- |
- |
- |
- |
Field
|
Met One
(ES-405)
 |
5200 |
PM1.0 |
0.84 to 0.91 |
2.8 to 3.6 |
- |
- |
Field
Lab
|
Met One
(ES-405)
 |
5200 |
PM2.5 |
0.80 to 0.92 |
3.5 to 4.0 |
0.99 |
19.0 to 21.2 |
Field
Lab
|
Met One
(ES-405)
 |
5200 |
PM10 |
0.78 to 0.92 |
4.5 to 8.9 |
0.99 |
10.4 to 24.4 |
Field
Lab
|
Met One
(Neighborhood Monitor)
 |
1900 |
PM2.5 |
0.53 to 0.67 |
6.0 to 8.4 |
- |
- |
Field
|
Moji China
(Airnut)
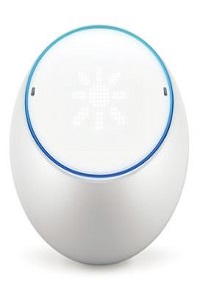 |
150 |
PM2.5 |
0.81 to 0.88 |
- |
- |
- |
Field
|
Oizom
(Dustroid Pro V6)
 |
6000 |
PM1.0 |
0.83 to 0.90 |
1.7 to 3.3 |
- |
- |
Field
|
Oizom
(Dustroid Pro V6)
 |
6000 |
PM2.5 |
0.84 to 0.93 |
2.1 to 4.8 |
- |
- |
Field
|
Oizom
(Dustroid Pro V6)
 |
6000 |
PM10 |
0.59 to 0.75 |
6.7 to 14.9 |
- |
- |
Field
|
Oizom
(Polludrone Smart)
 |
8000 |
PM1.0 |
0.82 to 0.86 |
4.5 to 5.0 |
- |
- |
Field
|
Oizom
(Polludrone Smart)
 |
8000 |
PM2.5 |
0.76 to 0.81 |
5.4 to 6.1 |
0.97 |
20.0 to 20.7 |
Field
Lab
|
Oizom
(Polludrone Smart)
 |
8000 |
PM10 |
0.33 to 0.34 |
14.3 to 15.5 |
- |
- |
Field
|
Origins
(Laser Egg)
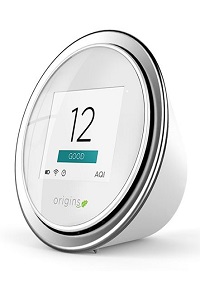 |
200 |
PM2.5 |
0.58 |
- |
- |
- |
Field
|
Origins
(Laser Egg)
 |
200 |
PM10 |
0 |
- |
- |
- |
Field
|
PAMAir
(Airmazing
PAS-OA-320-3G)
 |
500 |
PM2.5 |
0.84 to 0.86 |
3.8 to 4.0 |
- |
- |
Field
|
Perkin Elmer
(ELM)
 |
5200 |
PM |
0 |
20.6 to 30.5 |
- |
- |
Field
|
Piera Systems
(Canaree R1)
 |
299 |
PM1.0 |
0.82 to 0.91 |
3.2 to 4.5 |
0.99 |
4.4 to 11.5 |
Field
Lab
|
Piera Systems
(Canaree R1)
 |
299 |
PM2.5 |
0.69 to 0.90 |
6.3 to 7.2 |
0.99 |
31.3 to 44.0 |
Field
Lab
|
Piera Systems
(Canaree R1)
 |
299 |
PM10 |
0.19 to 0.35 |
16.3 to 22.6 |
- |
- |
Field
Lab
|
Plume Labs
(Flow 2)
 |
199 |
PM1.0 |
0.01 to 0.14 |
- |
- |
- |
Field
|
Plume Labs
(Flow 2)
 |
199 |
PM2.5 |
0.01 to 0.13 |
7.3 to 10.6 |
- |
- |
Field
|
Plume Labs
(Flow 2)
 |
199 |
PM10 |
0 to 0.04 |
19.3 to 28.3 |
- |
- |
Field
|
PM Monitor
(iMonPM)
 |
1995 |
PM1.0 |
0.77 to 0.89 |
2.2 to 3.8 |
0.98 |
1.1 to 2.4 |
Field
Lab
|
PM Monitor
(iMonPM)
 |
1995 |
PM2.5 |
0.76 to 0.89 |
3.4 to 4.3 |
0.98 |
2.7 to 4.1 |
Field
Lab
|
PM Monitor
(iMonPM)
 |
1995 |
PM10 |
0.38 to 0.62 |
12.0 to 17.8 |
0.99 |
8.2 to 9.4 |
Field
Lab
|
PurpleAir
(PA-I)
 |
150 |
PM1.0 |
0.93 to 0.95 |
- |
0.95 |
- |
Field
Lab
|
PurpleAir
(PA-I)
 |
150 |
PM2.5 |
0.90 to 0.92 |
- |
0.99 |
- |
Field
Lab
|
PurpleAir
(PA-I)
 |
150 |
PM10 |
0.32 to 0.44 |
- |
0.97 |
- |
Field
Lab
|
PurpleAir
(PA-I-Indoor)
 |
180 |
PM1.0 |
- |
- |
0.99 |
5.1 to 9.5 |
Field
Lab
|
PurpleAir
(PA-I-Indoor)
 |
180 |
PM2.5 |
0.75 |
- |
0.99 |
18.7 to 27.7 |
Field
Lab
|
PurpleAir
(PA-I-Indoor)
 |
180 |
PM10 |
0.36 to 0.46 |
- |
0.97 |
4.4 to 20.4 |
Field
Lab
|
PurpleAir
(PA-II)
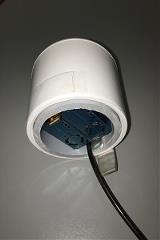 |
200 |
PM1.0 |
0.96 to 0.98 |
- |
0.99 |
11.7 to 15.9 |
Field
Lab
|
PurpleAir
(PA-II)
 |
200 |
PM2.5 |
0.93 to 0.97 |
- |
0.99 |
1.7 to 4.2 |
Field
Lab
|
PurpleAir
(PA-II)
 |
200 |
PM10 |
0.66 to 0.70 |
- |
0.95 |
15.6 to 20.5 |
Field
Lab
|
PurpleAir
(PA-II-FLEX)
 |
299 |
PM1.0 |
0.91 to 0.94 |
1.4 to 2.2 |
0.99 |
13.5 to 14.6 |
Field
Lab
|
PurpleAir
(PA-II-FLEX)
 |
299 |
PM2.5 |
0.78 to 0.88 |
3.4 to 3.8 |
0.99 |
1.7 to 2.2 |
Field
Lab
|
PurpleAir
(PA-II-FLEX)
 |
299 |
PM10 |
0.21 to 0.39 |
15.3 to 24.8 |
- |
- |
Field
Lab
|
Qingping
(Air Monitor)
 |
135 |
PM2.5 |
0.86 to 0.90 |
1.8 to 2.3 |
- |
- |
Field
|
Qingping
(Air Monitor Lite)
 |
96 |
PM2.5 |
0.85 to 0.93 |
1.8 to 3.6 |
- |
- |
Field
|
Qingping
(Air Monitor Lite)
 |
96 |
PM10 |
0.37 to 0.43 |
16.2 to 20.1 |
- |
- |
Field
|
QuantAQ
(MODULAIR-PM)
 |
1295 |
PM1.0 |
0.87 to 0.94 |
4.1 to 6.8 |
- |
- |
Field
|
QuantAQ
(MODULAIR-PM)
 |
1295 |
PM2.5 |
0.84 to 0.88 |
4.0 to 5.2 |
- |
- |
Field
|
QuantAQ
(MODULAIR-PM)
 |
1295 |
PM10 |
0.46 to 0.78 |
14.7 to 21.6 |
- |
- |
Field
|
Redspira
 |
180 |
PM2.5 |
0.73 to 0.87 |
4.7 to 7.1 |
0.99 |
11.4 to 16.2 |
Field
Lab
|
Redspira
 |
180 |
PM10 |
0.31 to 0.37 |
30.8 to 33.1 |
- |
- |
Field
Lab
|
RTI
(MicroPEM)
 |
2000 |
PM2.5 |
0.65 to 0.90 |
6.4 to 8.3 |
0.99 |
- |
Field
Lab
|
SailBri Cooper
(SCI-901)
 |
5500 |
PM2.5 |
0.79 to 0.89 |
2.2 to 3.1 |
- |
- |
Field
|
SailBri Cooper
(SCI-901)
 |
5500 |
PM10 |
0.64 to 0.82 |
5.6 to 14.1 |
- |
- |
Field
|
SainSmart
(Pure MorningP3)
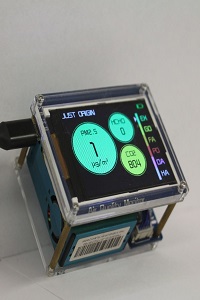 |
170 |
PM2.5 |
0.71 to 0.74 |
4.8 to 5.4 |
0.99 |
- |
Field
Lab
|
SamyoungS&C
(SY-DS-DK3)
 |
100 |
PM2.5 |
0.60 to 0.62 |
4.8 to 11.4 |
0.98 |
36.1 to 51.8 |
Field
Lab
|
Sensirion
(Nubo)
Discontinued
 |
2000 |
PM1.0 |
0.96 |
2.8 to 3.2 |
0.99 |
1.9 to 4.5 |
Field
Lab
|
Sensirion
(Nubo)
Discontinued
 |
2000 |
PM2.5 |
0.91 |
4.7 to 5.2 |
0.99 |
4.9 to 7.6 |
Field
Lab
|
Sensirion
(Nubo Air)
 |
1700 |
PM1.0 |
0.77 to 0.89 |
2.9 to 3.5 |
- |
- |
Field
|
Sensirion
(Nubo Air)
 |
1700 |
PM2.5 |
0.73 to 0.83 |
5.2 to 6.5 |
- |
- |
Field
|
Sensirion
(SEN44)
 |
53 |
PM1.0 |
0.89 |
1.6 to 1.7 |
- |
- |
Field
|
Sensirion
(SEN44)
 |
53 |
PM2.5 |
0.82 |
2.9 to 3.0 |
- |
- |
Field
|
Sensirion
(SEN44)
 |
53 |
PM10 |
0.22 |
20.7 to 20.8 |
- |
- |
Field
|
Sensirion
(SEN54)
 |
23 |
PM1.0 |
0.87 to 0.88 |
2.1 to 2.4 |
- |
- |
Field
|
Sensirion
(SEN54)
 |
23 |
PM2.5 |
0.76 to 0.77 |
3.5 |
- |
- |
Field
|
Sensirion
(SEN54)
 |
23 |
PM10 |
0.18 to 0.19 |
28.6 to 28.7 |
- |
- |
Field
|
Sensirion
(SPS30)
 |
100 |
PM1.0 |
0.91 |
1.3 to 1.4 |
0.99 |
0.8 to 1.4 |
Field
Lab
|
Sensirion
(SPS30)
 |
100 |
PM2.5 |
0.80 to 0.83 |
2.0 to 5.1 |
0.99 |
5.4 to 6.5 |
Field
Lab
|
Sensirion
(SPS30)
 |
100 |
PM10 |
0.07 to 0.20 |
10.8 to 24.7 |
- |
- |
Field
Lab
|
Shinyei
(PM Evaluation Kit)
 |
1000 |
PM2.5 |
0.80 to 0.89 |
- |
0.93 |
- |
Field
Lab
|
Strop de aer
 |
175 |
PM2.5 |
0.71 to 0.77 |
6.3 to 8.8 |
0.99 |
29.0 to 32.0 |
Field
Lab
|
Strop de aer
 |
175 |
PM10 |
0.15 to 0.26 |
19.5 to 30.7 |
- |
- |
Field
Lab
|
Tera Sensor
(NextPM)
 |
70 |
PM1.0 |
0.89 to 0.94 |
2.1 to 4.6 |
- |
- |
Field
Lab
|
Tera Sensor
(NextPM)
 |
70 |
PM2.5 |
0.87 to 0.95 |
3.9 to 5.6 |
0.99 |
30.2 to 32.0 |
Field
Lab
|
Tera Sensor
(NextPM)
 |
70 |
PM10 |
0.34 to 0.66 |
26.2 to 31.6 |
0.99 |
23.9 to 24.4 |
Field
Lab
|
TSI
(AirAssure)
 |
1500 |
PM2.5 |
0.81 to 0.83 |
- |
0.99 |
32.4 to 55.0 |
Field
Lab
|
TSI
(BlueSky)
 |
400 |
PM2.5 |
0.65 to 0.76 |
4.9 to 5.9 |
0.99 |
3.1 to 6.2 |
Field
Lab
|
TSI
(BlueSky)
 |
400 |
PM10 |
0.09 to 0.21 |
22.7 to 26.3 |
- |
- |
Field
Lab
|
uHoo
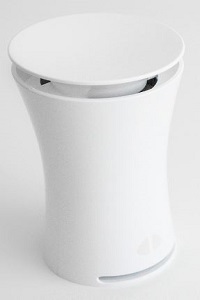 |
300 |
PM2.5 |
0 |
9.5 to 17.8 |
- |
- |
Field
|
2B Technologies
(POM)
 |
4500 |
O3 (UV, FEM) |
1 |
1.0 to 1.9 |
0.99 |
3.7 to 14.5 |
Field
Lab
|
Aeroqual
(AQY-R)
 |
5000 |
NO2 (EC) |
0.82 to 0.86 |
2.8 to 3.1 |
0.99 |
28.7 to 66.1 |
Field
Lab
|
Aeroqual
(AQY-R)
 |
5000 |
O3 (MOx) |
0.94 to 0.98 |
3.0 to 4.8 |
0.99 |
7.7 to 27.4 |
Field
Lab
|
Aeroqual
(AQY v0.5)
Discontinued
 |
3000 |
NO2 (EC) |
0.77 |
- |
0.98 |
- |
Field
Lab
|
Aeroqual
(AQY v0.5)
Discontinued
 |
3000 |
O3 (MOx) |
0.95 |
- |
0.98 |
- |
Field
Lab
|
Aeroqual
(AQY v1.0)
 |
4000 |
NO2 (EC) |
0.60 to 0.77 |
4.1 to 5.3 |
- |
- |
Field
|
Aeroqual
(AQY v1.0)
 |
4000 |
O3 (MOx) |
0.96 to 0.97 |
2.4 to 7.3 |
- |
- |
Field
|
Aeroqual
(S-500)
 |
500 |
O3 (MOx) |
0.85 |
- |
0.99 |
- |
Field
Lab
|
Airly
 |
1000 |
NO2 (EC) |
0.54 to 0.80 |
42.4 to 48.1 |
- |
- |
Field
|
Airly
 |
1000 |
O3 (EC) |
0.90 to 0.94 |
19.3 to 22.9 |
- |
- |
Field
|
Air Quality Egg
(Ver. 1)
 |
200 |
CO (MOx) |
0 |
- |
- |
- |
Field
|
Air Quality Egg
(Ver. 1)
 |
200 |
NO2 (MOx) |
0.4 |
- |
- |
- |
Field
|
Air Quality Egg
(Ver. 1)
 |
200 |
O3 (MOx) |
0.85 |
- |
- |
- |
Field
|
Air Quality Egg
(Ver. 2)
 |
240 |
CO (EC) |
0 |
- |
- |
- |
Field
|
Air Quality Egg
(Ver. 2)
 |
240 |
NO2 (EC) |
0 |
- |
- |
- |
Field
|
Air Quality Egg
(Ver. 2)
 |
240 |
O3 (EC) |
0.0 to 0.20 |
- |
- |
- |
Field
|
Air Quality Egg
(Ver. 2)
 |
240 |
SO2 (EC) |
- |
- |
- |
- |
|
Air Quality Egg
(2022 Model)
 |
671 |
CO (EC) |
0.60 to 0.78 |
150 to 210.0 |
- |
- |
Field
|
Air Quality Egg
(2022 Model)
 |
671 |
NO2 (EC) |
0.39 to 0.55 |
20.8 to 32.0 |
0.99 |
5.5 to 61.8 |
Field
Lab
|
Air Quality Egg
(2022 Model)
 |
671 |
O3 (EC) |
0.20 to 0.51 |
13.2 to 18.0 |
0.98 |
4.7 to 21.0 |
Field
Lab
|
Air Quality Egg
(2024 Model)
 |
1914 |
CO (EC) |
0.38 to 0.74 |
125.3 to 207.4 |
|
|
Field
|
Air Quality Egg
(2024 Model)
 |
1914 |
NO2 (EC) |
0.80 to 0.81 |
32.9 to 36.2 |
|
|
Field
|
Air Quality Egg
(2024 Model)
 |
1914 |
O3 (EC) |
0.56 to 0.74 |
18.9 to 22.8 |
|
|
Field
|
APIS
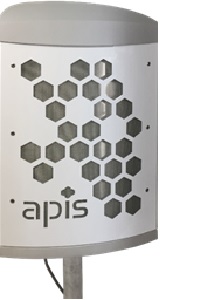 |
4995 |
CO (EC) |
0.87 to 0.90 |
70.0 to 99.8 |
- |
- |
Field
|
APIS
 |
4995 |
NO (EC) |
0.87 to 0.97 |
1.3 to 2.6 |
- |
- |
Field
|
APIS
 |
4995 |
NO2 (EC) |
0.30 to 0.44 |
6.1 to 9.4 |
- |
- |
Field
|
APIS
 |
4995 |
O3 (EC) |
0.73 to 0.83 |
14.2 to 19.1 |
- |
- |
Field
|
AQMesh
(V4.0)
Discontinued
 |
10000 |
CO (EC) |
0.42 to 0.80 |
- |
- |
- |
Field
|
AQMesh
(V4.0)
Discontinued
 |
10000 |
NO (EC) |
0.0 to 0.44 |
- |
- |
- |
Field
|
AQMesh
(V4.0)
Discontinued
 |
10000 |
NO2 (EC) |
0.0 to 0.46 |
- |
- |
- |
Field
|
AQMesh
(V4.0)
Discontinued
 |
10000 |
O3 (EC) |
0.46 to 0.83 |
- |
- |
- |
Field
|
AQMesh
(v3.0 PM, v5.1 Gas)
 |
7800 |
CO (EC) |
0.90 to 0.94 |
40.0 to 52.3 |
- |
- |
Field
|
AQMesh
(v3.0 PM, v5.1 Gas)
 |
7800 |
NO (EC) |
0.67 to 0.76 |
10.9 to 12.3 |
- |
- |
Field
|
AQMesh
(v3.0 PM, v5.1 Gas)
 |
7800 |
NO2 (EC) |
0.49 to 0.54 |
7.6 to 8.4 |
- |
- |
Field
|
AQMesh
(v3.0 PM, v5.1 Gas)
 |
7800 |
NOx (EC) |
0.73 to 0.84 |
15.0 to 18.9 |
- |
- |
Field
|
AQMesh
(v3.0 PM, v5.1 Gas)
 |
7800 |
O3 (EC) |
0.62 to 0.74 |
12.9 to 14.4 |
- |
- |
Field
|
AQMesh
(v3.0 PM, v5.1 Gas)
 |
7800 |
SO2 (EC) |
- |
- |
- |
- |
Field
|
Atmocube
 |
800 |
CO (EC) |
0.0 to 0.11 |
218.2 to 699.2 |
|
|
Field
|
Atmocube
 |
800 |
O3 (EC) |
0.65 to 0.83 |
34.0 to 36.7 |
|
|
Field
|
A.U.G. Signals Ltd
(AirSENCE Standard
AS400X)
 |
4000 |
CO (EC) |
0.75 to 0.78 |
57.7 to 60.9 |
|
|
Field
|
A.U.G. Signals Ltd
(AirSENCE Standard
AS400X)
 |
4000 |
NO (EC) |
0.52 to 0.87 |
8.1 to 11.5 |
|
|
Field
|
A.U.G. Signals Ltd
(AirSENCE Standard
AS400X)
 |
4000 |
NO2 (EC) |
0.16 to 0.21 |
9.2 to 9.8 |
|
|
Field
|
A.U.G. Signals Ltd
(AirSENCE Standard
AS400X)
 |
4000 |
O3 (EC) |
0.82 to 0.85 |
9.0 to 9.3 |
|
|
Field
|
CairPol Cairsens
(CO)
 |
1243 |
CO (EC) |
0.93 to 0.94 |
93.6 to 134.9 |
- |
- |
Field
|
CairPol Cairsens
(NO2)
 |
1198 |
NO2 (EC) |
0.0 to 0.12 |
6.0 to 14.6 |
- |
- |
Field
|
Ecomesure
(EcomSmart)
 |
4550 |
CO (EC) |
0.75 to 0.81 |
79.4 to 125.1 |
0.91 |
873.8 to 1277.5 |
Field
Lab
|
Ecomesure
(EcomSmart)
 |
4550 |
O3 (EC) |
0.63 to 0.64 |
11.4 to 25.7 |
0.87 |
13.4 to 30.2 |
Field
Lab
|
Ecomesure
(EcomSmart)
 |
4550 |
NO2 (EC) |
0.39 to 0.56 |
13.3 to 21.6 |
0.89 |
81.1 to 85.0 |
Field
Lab
|
Igienair
(Zaack AQI)
 |
3000 |
CO (EC) |
0.84 to 0.87 |
276.0 to 329.6 |
0.98 |
2604 to 3910 |
Field
Lab
|
Igienair
(Zaack AQI)
 |
3000 |
NO2 (EC) |
0.53 to 0.58 |
7.2 to 8.0 |
0.99 |
12.9 to 13.3 |
Field
Lab
|
Igienair
(Zaack AQI)
 |
3000 |
O3 (EC) |
0 |
20.7 to 23.9 |
0.98 |
18.0 to 24.4 |
Field
Lab
|
Kunak
(Air A10)
 |
5000 |
CO (EC) |
0.55 to 0.60 |
38.9 to 42.0 |
- |
- |
Field
|
Kunak
(Air A10)
 |
5000 |
NO (EC) |
0.78 to 0.93 |
1.1 to 1.7 |
- |
- |
Field
|
Kunak
(Air A10)
 |
5000 |
NO2 (EC) |
0.24 to 0.32 |
6.6 to 7.4 |
- |
- |
Field
|
Kunak
(Air A10)
 |
5000 |
O3 (EC) |
0.86 to 0.88 |
4.8 to 5.9 |
- |
- |
Field
|
Kunak
(Air Lite)
 |
5033 |
NO2 (EC) |
0.66 to 0.70 |
4.2 to 4.5 |
|
|
Field
|
Kunak
(Air Lite)
 |
5033 |
O3 (EC) |
0.85 to 0.89 |
4.7 to 6.8 |
|
|
Field
|
Kunak
(Air Pro)
 |
8500 |
CO (EC) |
0.84 to 0.86 |
54.6 to 57.5 |
|
|
Field
|
Kunak
(Air Pro)
 |
8500 |
NO (EC) |
0.99 |
2.4 to 2.9 |
|
|
Field
|
Kunak
(Air Pro)
 |
8500 |
NO2 (EC) |
0.69 to 0.75 |
3.9 to 4.3 |
|
|
Field
|
Kunak
(Air Pro)
 |
8500 |
NOx (EC) |
0.93 to 0.94 |
4.5 to 5.0 |
|
|
Field
|
Kunak
(Air Pro)
 |
8500 |
O3 (EC) |
0.85 to 0.89 |
5.6 to 6.5 |
|
|
Field
|
Liveable Cities
(SLX-NO2)
 |
569 |
NO2 (EC) |
0.42 to 0.55 |
18.4 to 18.8 |
- |
- |
Field
|
Liveable Cities
(SLX-O3)
 |
569 |
O3 (MOx) |
0.08 to 0.10 |
14.2 to 19.1 |
- |
- |
Field
|
Magnasci SRL
(uRADMonitor
INDUSTRIAL HW103)
 |
1300 |
CO (EC) |
0.00 to 0.07 |
224.9 to 290.7 |
- |
- |
Field
|
Magnasci SRL
(uRADMonitor
INDUSTRIAL HW103)
 |
1300 |
NO2 (EC) |
0.00 to 0.05 |
11.6 to 24.8 |
- |
- |
Field
|
Magnasci SRL
(uRADMonitor
INDUSTRIAL HW103)
 |
1300 |
O3 (EC) |
0.00 to 0.08 |
15.0 to 19.5 |
- |
- |
Field
|
Oizom
(Polludrone Smart)
 |
8000 |
CO (EC) |
0.64 to 0.71 |
76 to 81 |
0.35 |
2632 to 2981 |
Field
Lab
|
Oizom
(Polludrone Smart)
 |
8000 |
NO (EC) |
0.10 to 0.35 |
21.1 to 24.6 |
- |
- |
Field
|
Oizom
(Polludrone Smart)
 |
8000 |
NO2 (EC) |
0.002 to 0.03 |
20.6 to 29.1 |
- |
- |
Field
|
Oizom
(Polludrone Smart)
 |
8000 |
O3 (EC) |
0.14 to 0.23 |
18.9 to 19.7 |
- |
- |
Field
|
Perkin Elmer
(ELM)
 |
5200 |
NO2 (MOx) |
0 |
11.9 to 14.1 |
- |
- |
Field
|
Perkin Elmer
(ELM)
 |
5200 |
O3 (MOx) |
0.89 to 0.96 |
4.6 to 9.8 |
- |
- |
Field
|
Plume Labs
(Flow 2)
 |
199 |
NO2 (MOx) |
0.04 to 0.14 |
11.2 to 17.6 |
- |
- |
Field
|
Smart Citizen Kit
 |
200 |
CO (MOx) |
0.50 to 0.85 |
- |
- |
- |
Field
|
Smart Citizen Kit
 |
200 |
NO2 (MOx) |
0 |
- |
- |
- |
Field
|
Spec Sensorss
 |
500 |
CO (EC) |
0.84 to 0.90 |
- |
- |
- |
Field
|
Spec Sensorss
 |
500 |
NO2 (EC) |
0.0 to 0.16 |
- |
- |
- |
Field
|
Spec Sensorss
 |
500 |
O3 (EC) |
0.0 to 0.24 |
- |
- |
- |
Field
|
uHoo
 |
300 |
CO (MOx) |
0 |
360 |
- |
- |
Field
|
uHoo
 |
300 |
O3 (MOx) |
0.43 to 0.72 |
14.5 to 68.8 |
- |
- |
Field
|
UNITEC SENS-IT
(CO)
 |
2200 |
CO (MOx) |
0.33 to 0.43 |
117.1 to 736.8 |
0.99 |
- |
Field
Lab
|
UNITEC SENS-IT
(NO2)
 |
2200 |
NO2 (MOx) |
0.57 to 0.62 |
16.2 to 20.6 |
- |
- |
Field
|
UNITEC SENS-IT
(O3)
 |
2200 |
O3 (MOx) |
0.72 to 0.83 |
11.0 to 13.4 |
0.82 to 0.90 |
- |
Field
Lab
|
Vaisala
(AQT410)
Ver. 1.11
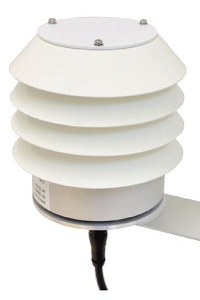 |
3700 |
CO (EC) |
0.28 to 0.31 |
- |
- |
- |
Field
|
Vaisala
(AQT410)
Ver. 1.11
 |
3700 |
NO2 (EC) |
0 |
- |
- |
- |
Field
|
Vaisala
(AQT410)
Ver. 1.11
 |
3700 |
O3 (EC) |
0.40 to 0.58 |
- |
- |
- |
Field
|
Vaisala
(AQT410)
Ver. 1.11
 |
3700 |
SO2 (EC) |
- |
- |
- |
- |
Field
|
Vaisala
(AQT410)
Ver. 1.15
 |
3700 |
CO (EC) |
0.80 to 0.83 |
222 to 234 |
- |
- |
Field
|
Vaisala
(AQT410)
Ver. 1.15
 |
3700 |
NO2 (EC) |
0.43 to 0.61 |
13.0 to 16.3 |
- |
- |
Field
|
Vaisala
(AQT410)
Ver. 1.15
 |
3700 |
O3 (EC) |
0.66 to 0.82 |
6.6 to 8.9 |
- |
- |
Field
|
Vaisala
(AQT410)
Ver. 1.15
 |
3700 |
SO2 (EC) |
- |
- |
- |
- |
Field
|
Vaisala
(AQT530)
Ver. 3.1
 |
3500 |
CO (EC) |
0.91 to 0.92 |
72.2 to 85.9 |
0.96 |
74.5 to 301.7 |
Field
Lab
|
Vaisala
(AQT530)
Ver. 3.1
 |
3500 |
NO (EC) |
0.67 to 0.71 |
15.6 to 22.3 |
- |
- |
Field
Lab
|
Vaisala
(AQT530)
Ver. 3.1
 |
3500 |
NO2 (EC) |
0.39 to 0.60 |
11.3 to 16.7 |
0.96 |
8.1 to 38.6 |
Field
Lab
|
Vaisala
(AQT530)
Ver. 3.1
 |
3500 |
O3 (EC) |
0.22 to 0.46 |
11.2 to 13.8 |
0.97 |
3.0 to 42.5 |
Field
Lab
|
Air Quality Egg
(2024 Model)
 |
1914 |
PM1.0 |
0.88 to 0.89 |
4.9 to 5.7 |
|
|
Field
|
Air Quality Egg
(2024 Model)
 |
1914 |
PM2.5 |
0.89 |
4.2 to 4.3 |
|
|
Field
|
Air Quality Egg
(2024 Model)
 |
1914 |
PM10 |
0.34 to 0.35 |
40.7 to 42.1 |
|
|
Field
|
Particles Plus
(Community CPC)
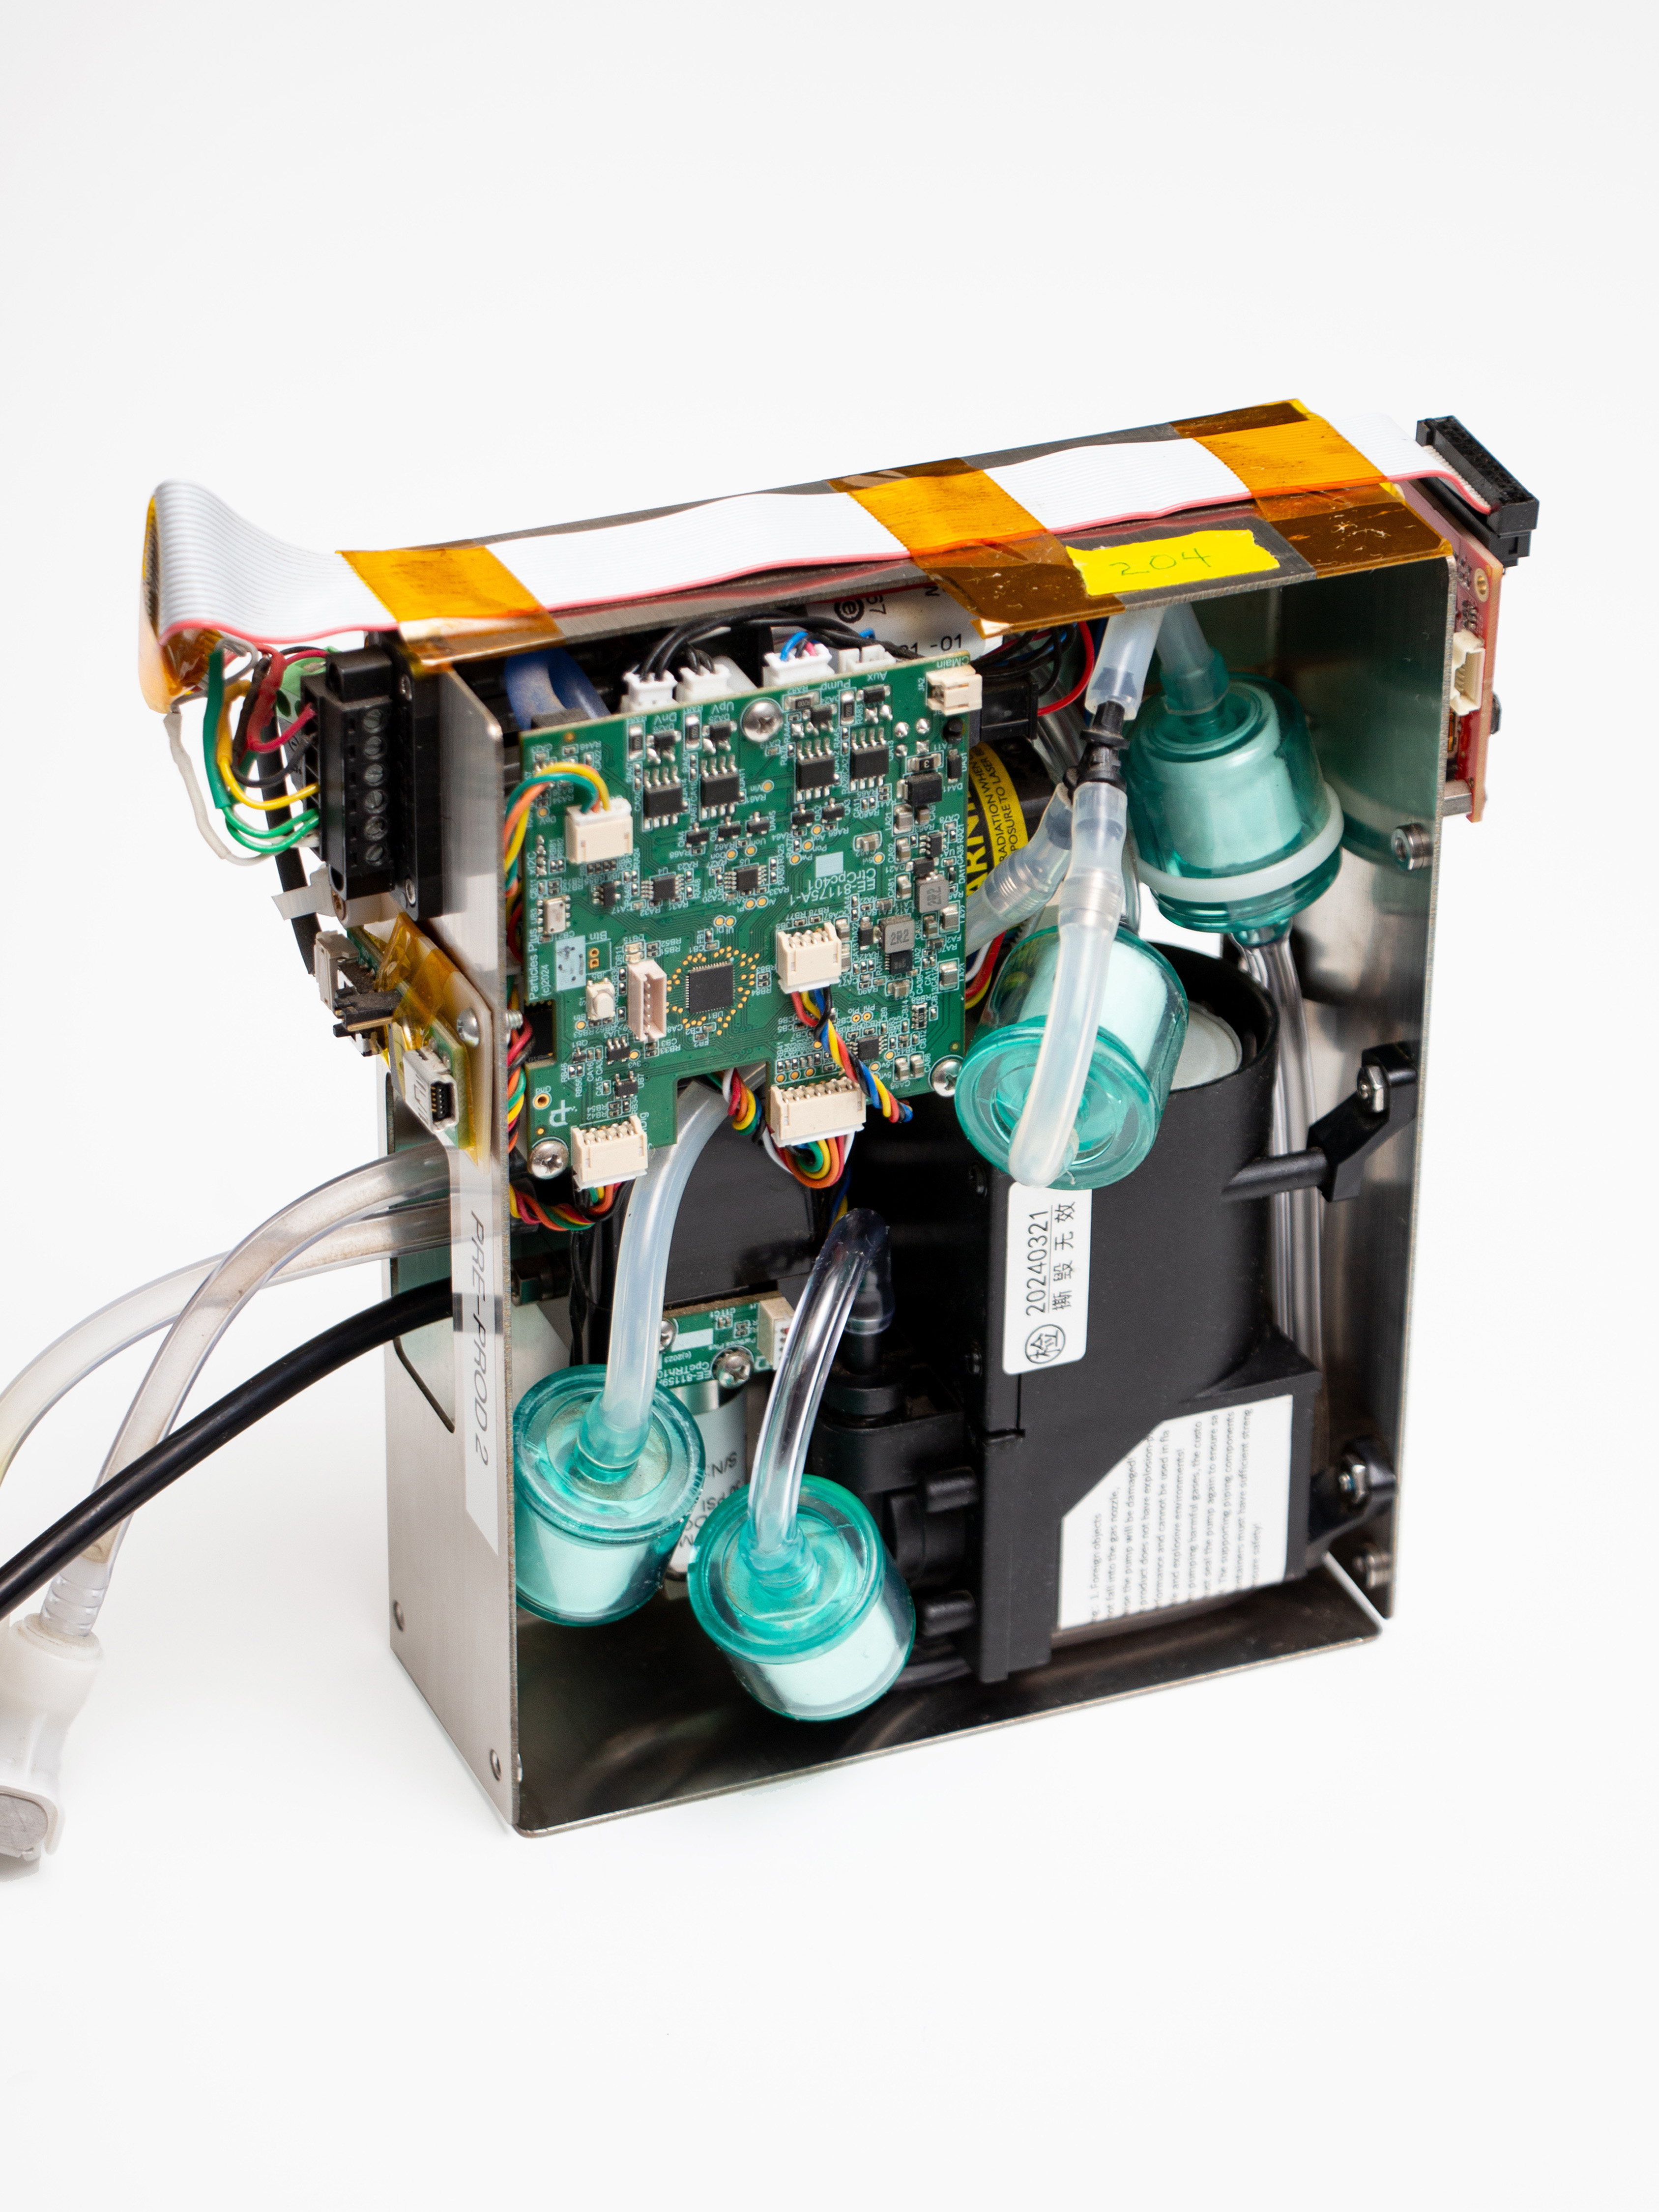 |
2995 |
UFP |
0.94 to 0.95 |
1045.4 to 1185.0 (#/cm3) |
|
|
Field
|
HabitatMap
(AirBeam Mini)
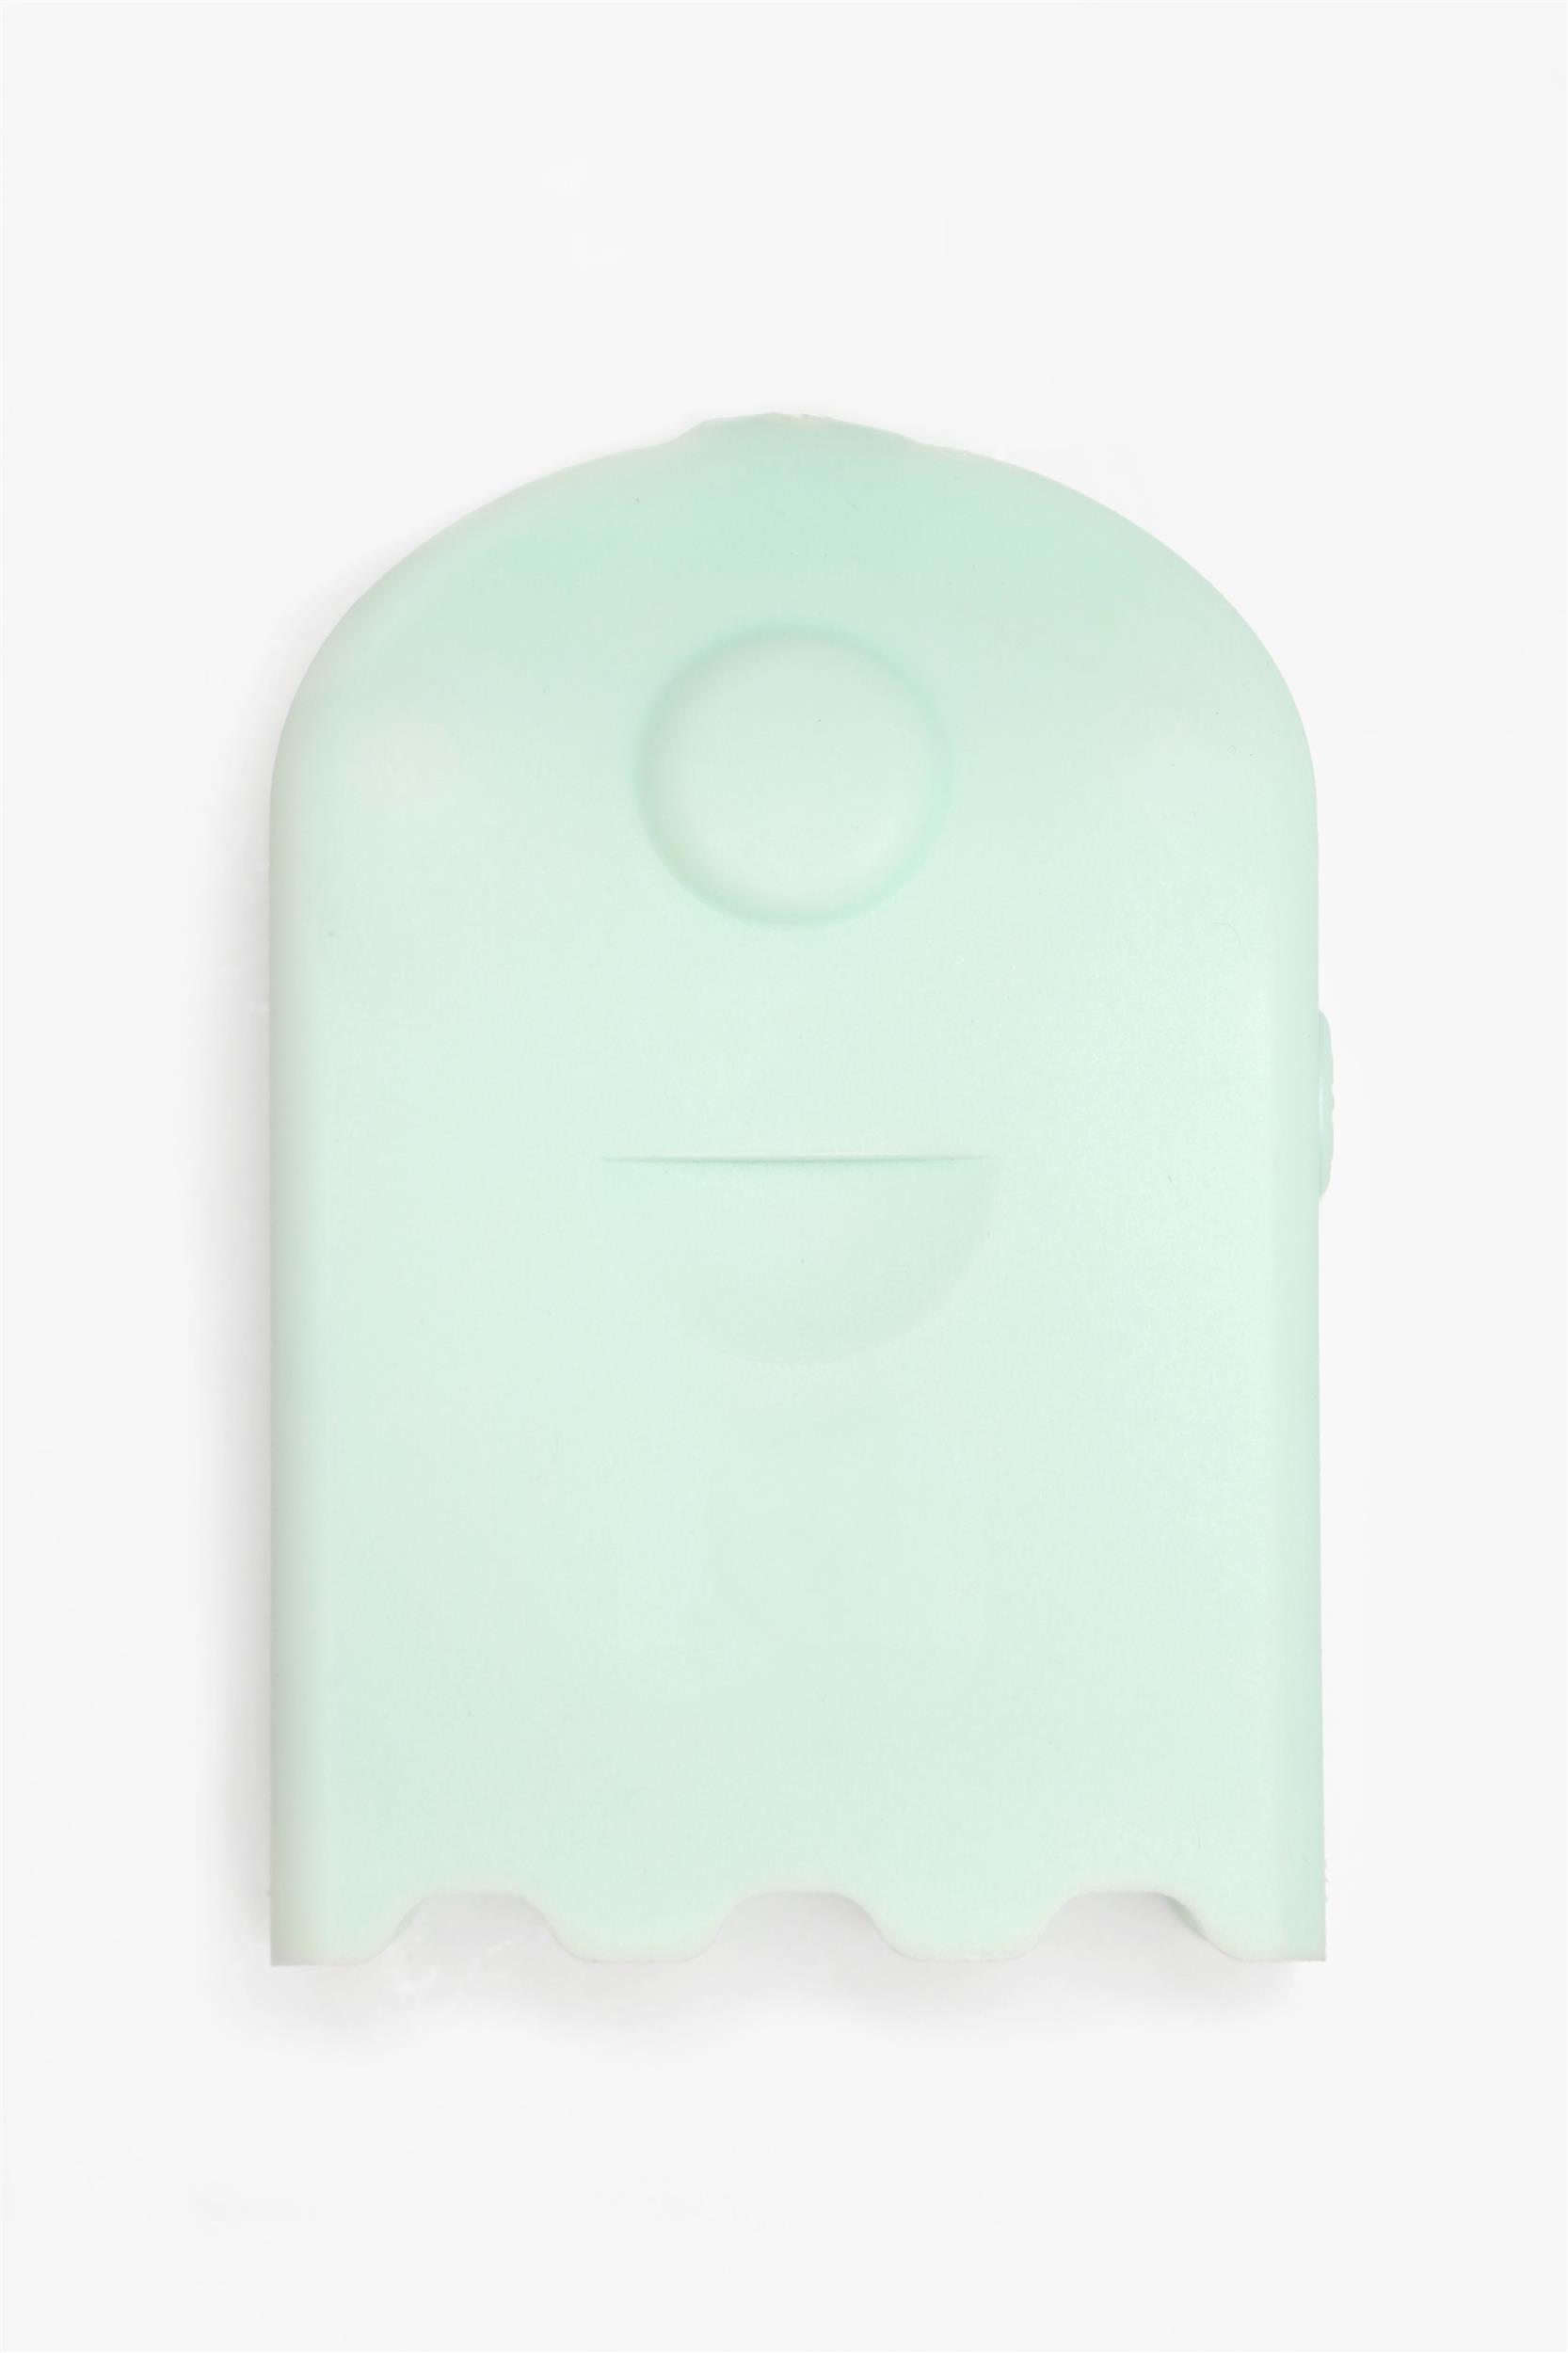 |
99 |
PM2.5 |
0.64 |
3.1 to 3.3 |
|
|
Field
|
Airthings
Space Pro
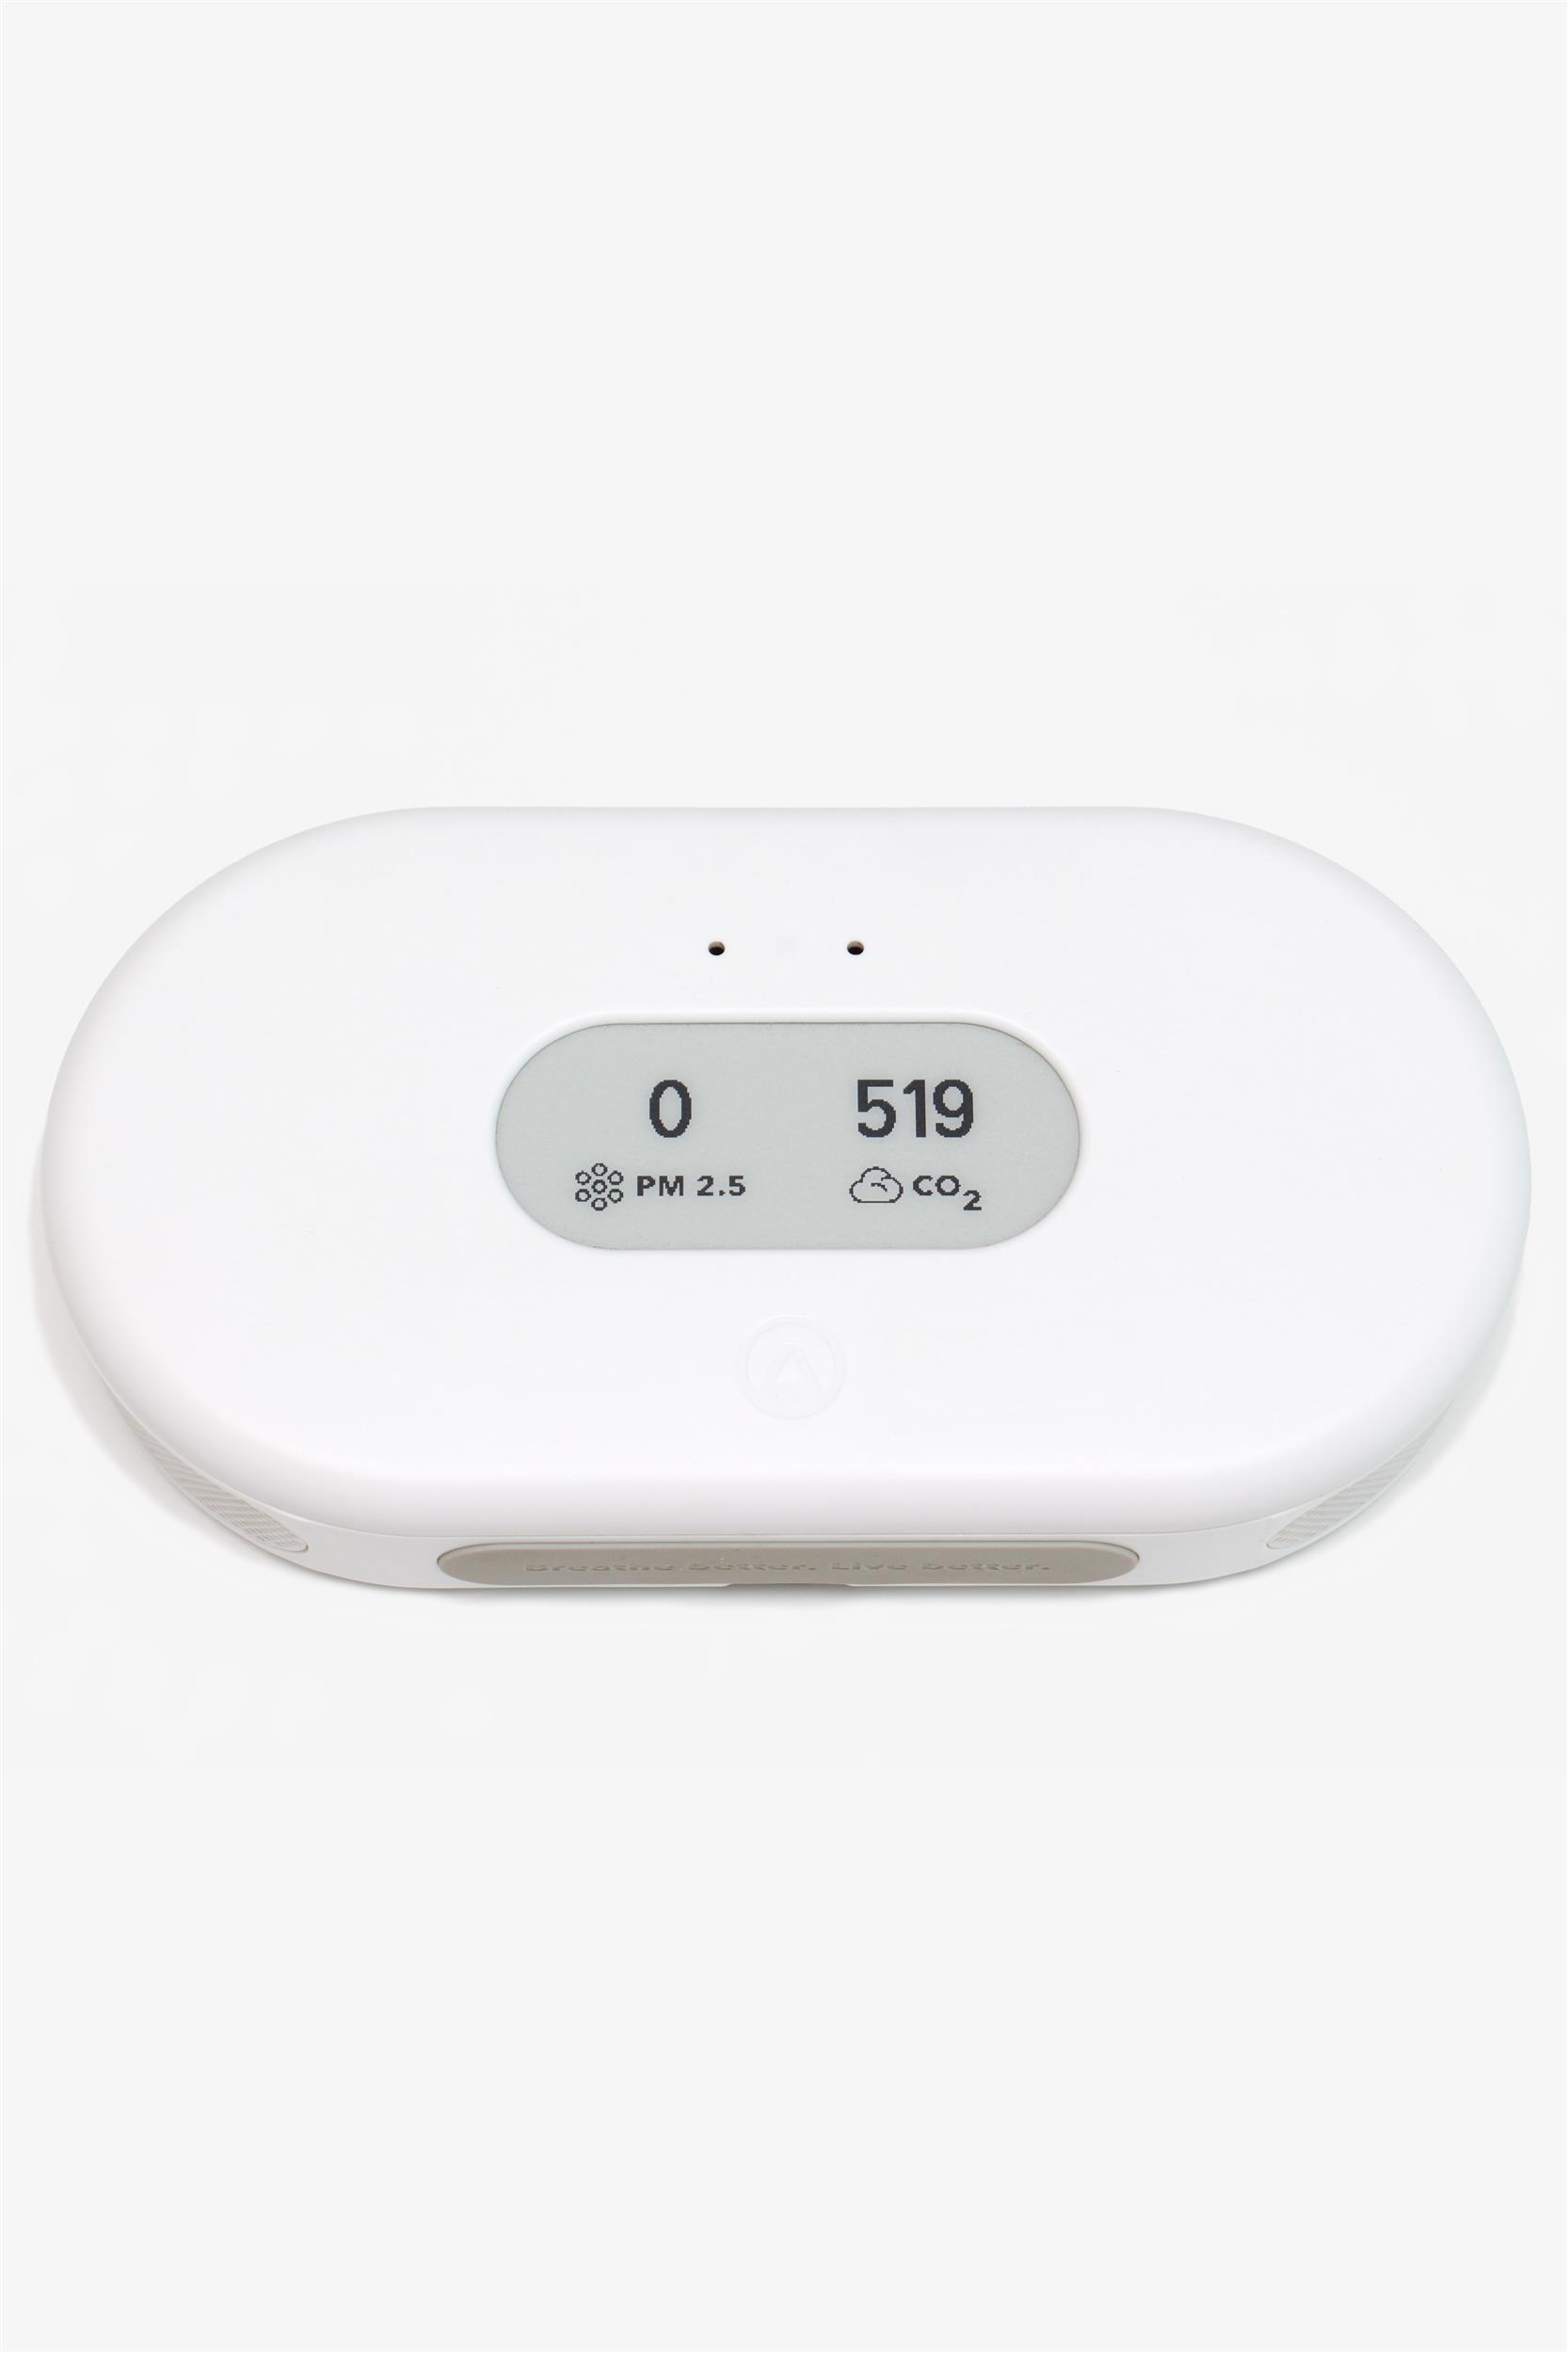 |
385 |
PM1.0 |
- |
- |
- |
- |
Field
|
Airthings
Space Pro
 |
385 |
PM2.5 |
0.44 to 0.49 |
5.4 to 8.3 |
- |
- |
Field
|
Airthings
Space Pro
 |
385 |
PM10 |
0.15 to 0.16 |
13.9 to 16.0 |
- |
- |
Field
|
Cubic Sensors
& Instruments
PM2012SE-B
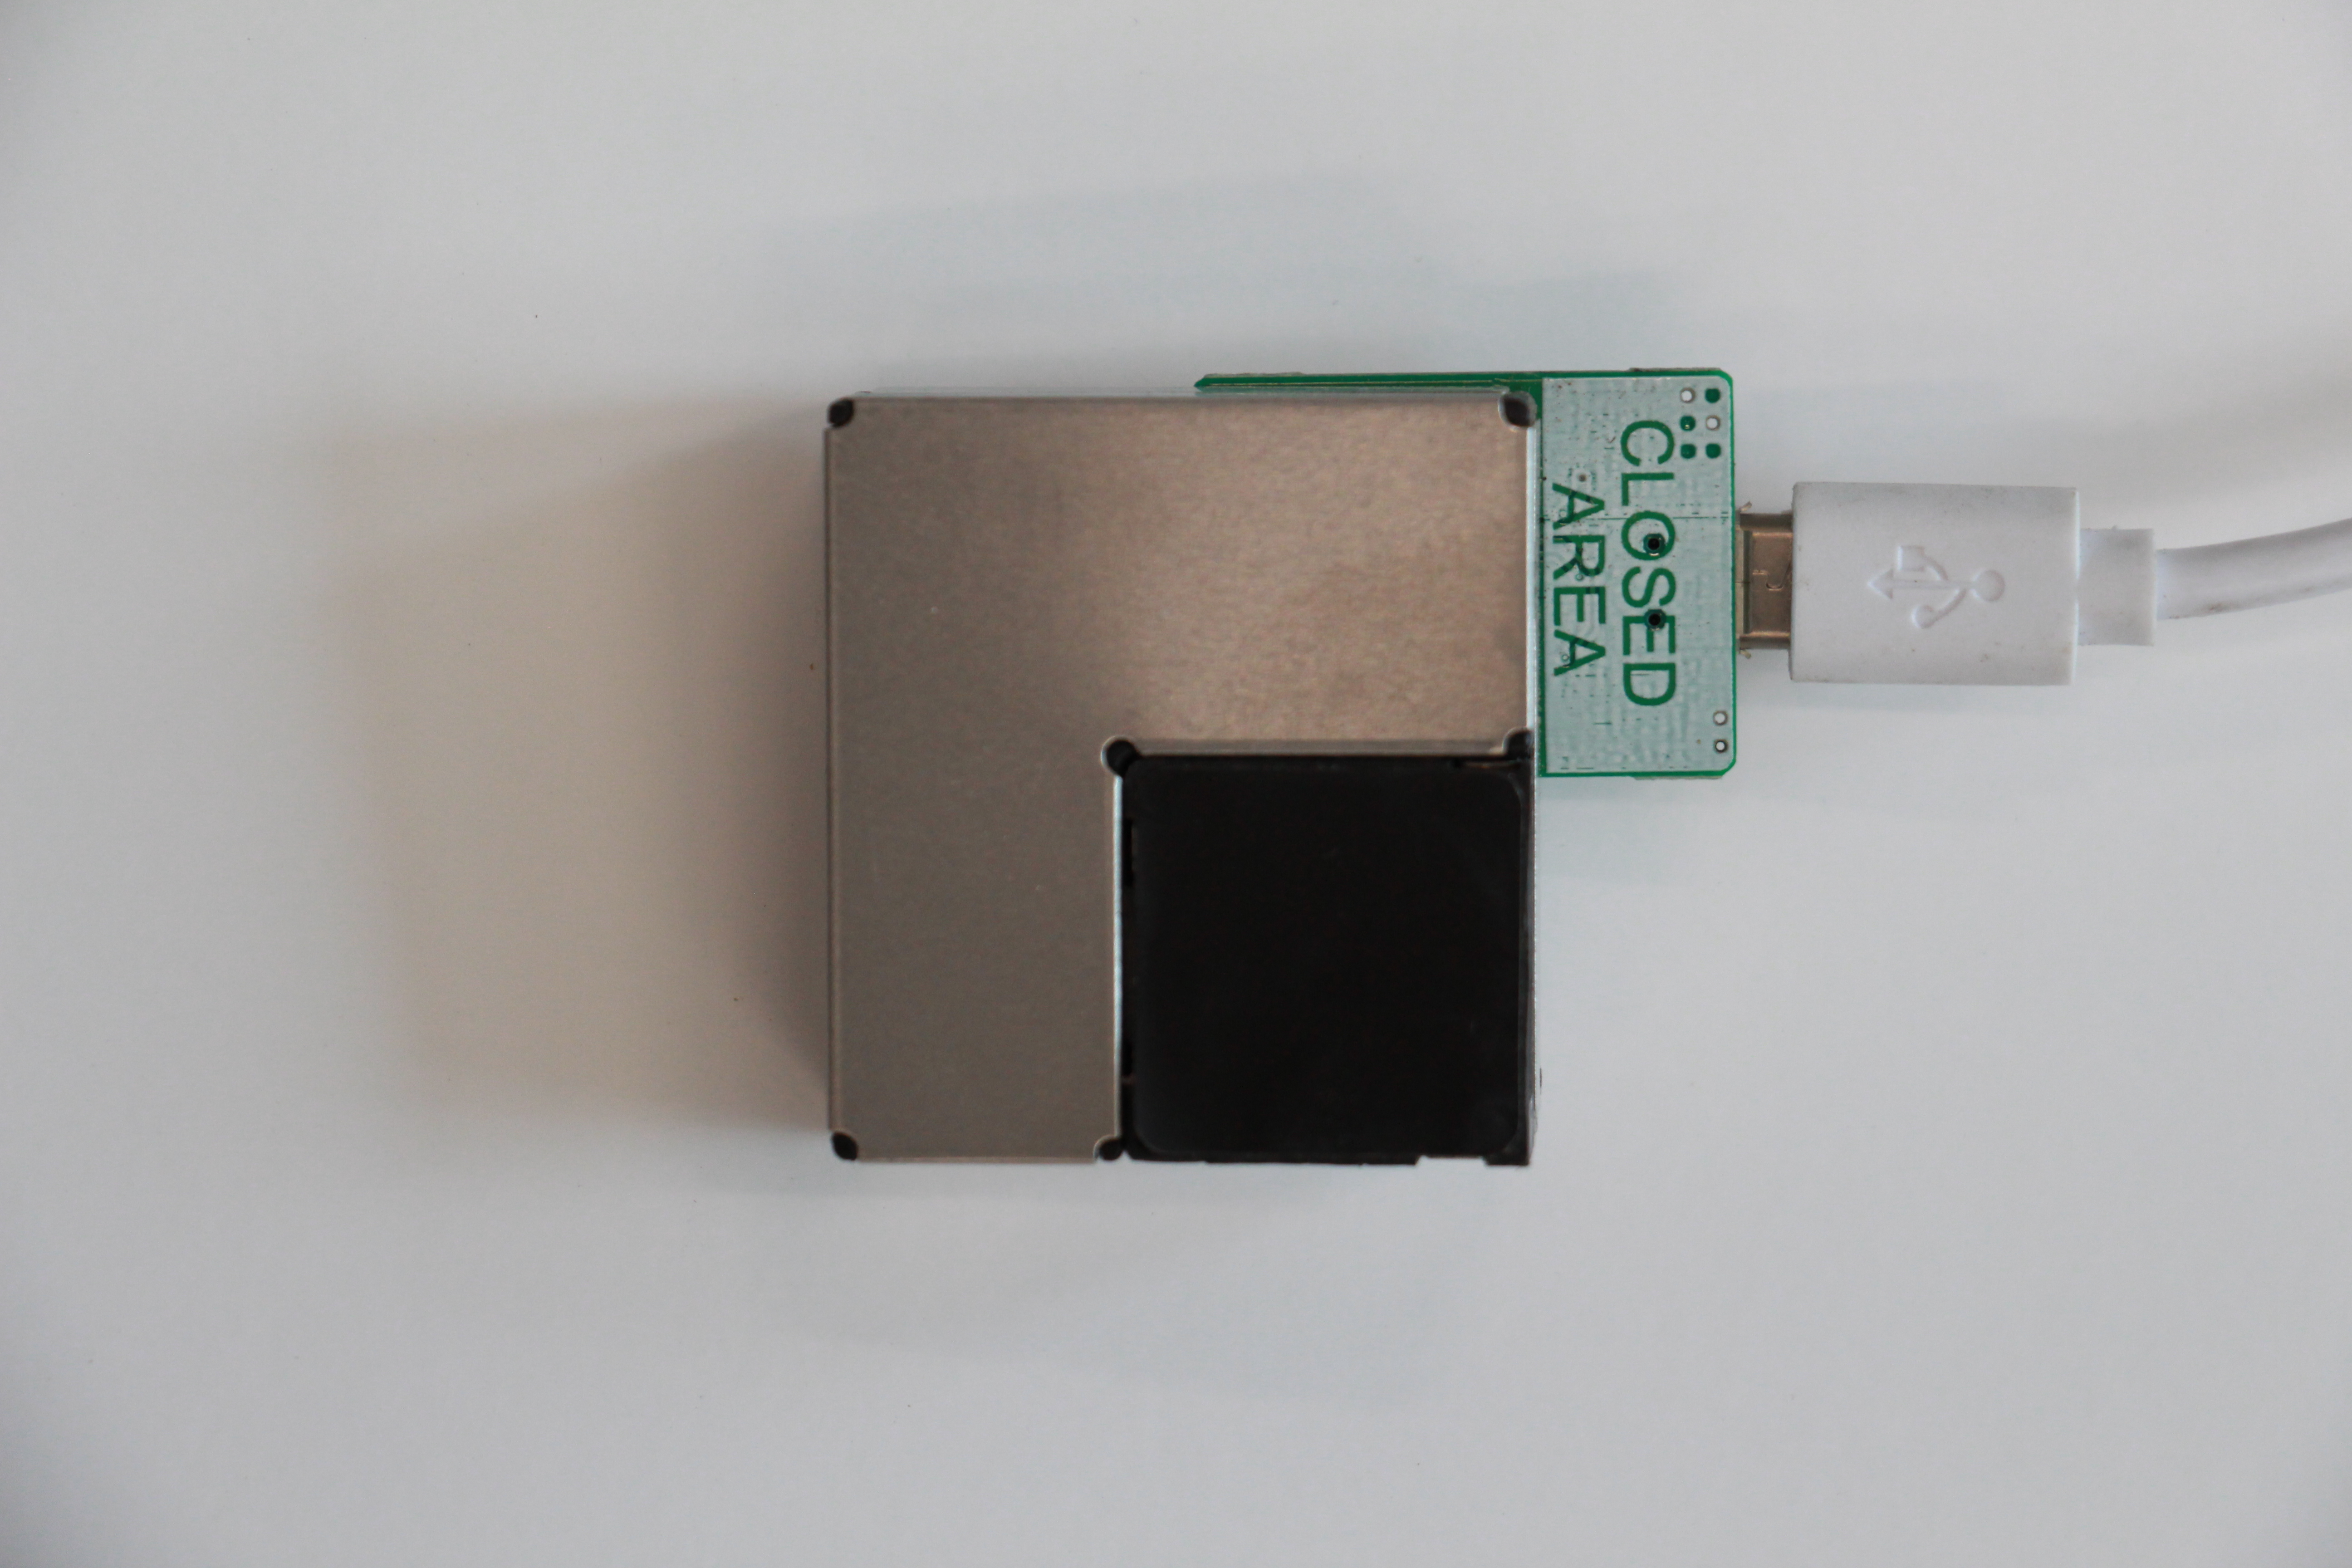 |
45 |
PM1.0 |
0.71 to 0.75 |
3.3 to 3.7 |
- |
- |
Field
|
Cubic Sensors
& Instruments
PM2012SE-B
 |
45 |
PM2.5 |
0.59 to 0.63 |
4.9 to 5.0 |
- |
- |
Field
|
Cubic Sensors
& Instruments
PM2012SE-B
 |
45 |
PM10 |
0.1 to 0.14 |
23.7 to 24.1 |
- |
- |
Field
|
Strop de Aer
PM-Ultimate
 |
250 |
PM1.0 |
0.69 to 0.72 |
3.4 to 3.6 |
- |
- |
Field
|
Strop de Aer
PM-Ultimate
 |
250 |
PM2.5 |
0.59 to 0.60 |
4.6 to 4.7 |
- |
- |
Field
|
Strop de Aer
PM-Ultimate
 |
250 |
PM10 |
0.12 to 0.13 |
25.4 to 25.8 |
- |
- |
Field
|
QuantAQ
(MODULAIR-PM; 2025 Evaluation)
 |
2495 |
PM1.0 |
- |
- |
- |
- |
Field
|
QuantAQ
(MODULAIR-PM; 2025 Evaluation)
 |
2495 |
PM2.5 |
0.86 to 0.93 |
4.4 to 5.3 |
- |
- |
Field
|
QuantAQ
(MODULAIR-PM; 2025 Evaluation)
 |
2495 |
PM10 |
0.78 to 0.90 |
12.3 to 15.8 |
- |
- |
Field
|
Bettair
(Static Node MK2 Series)
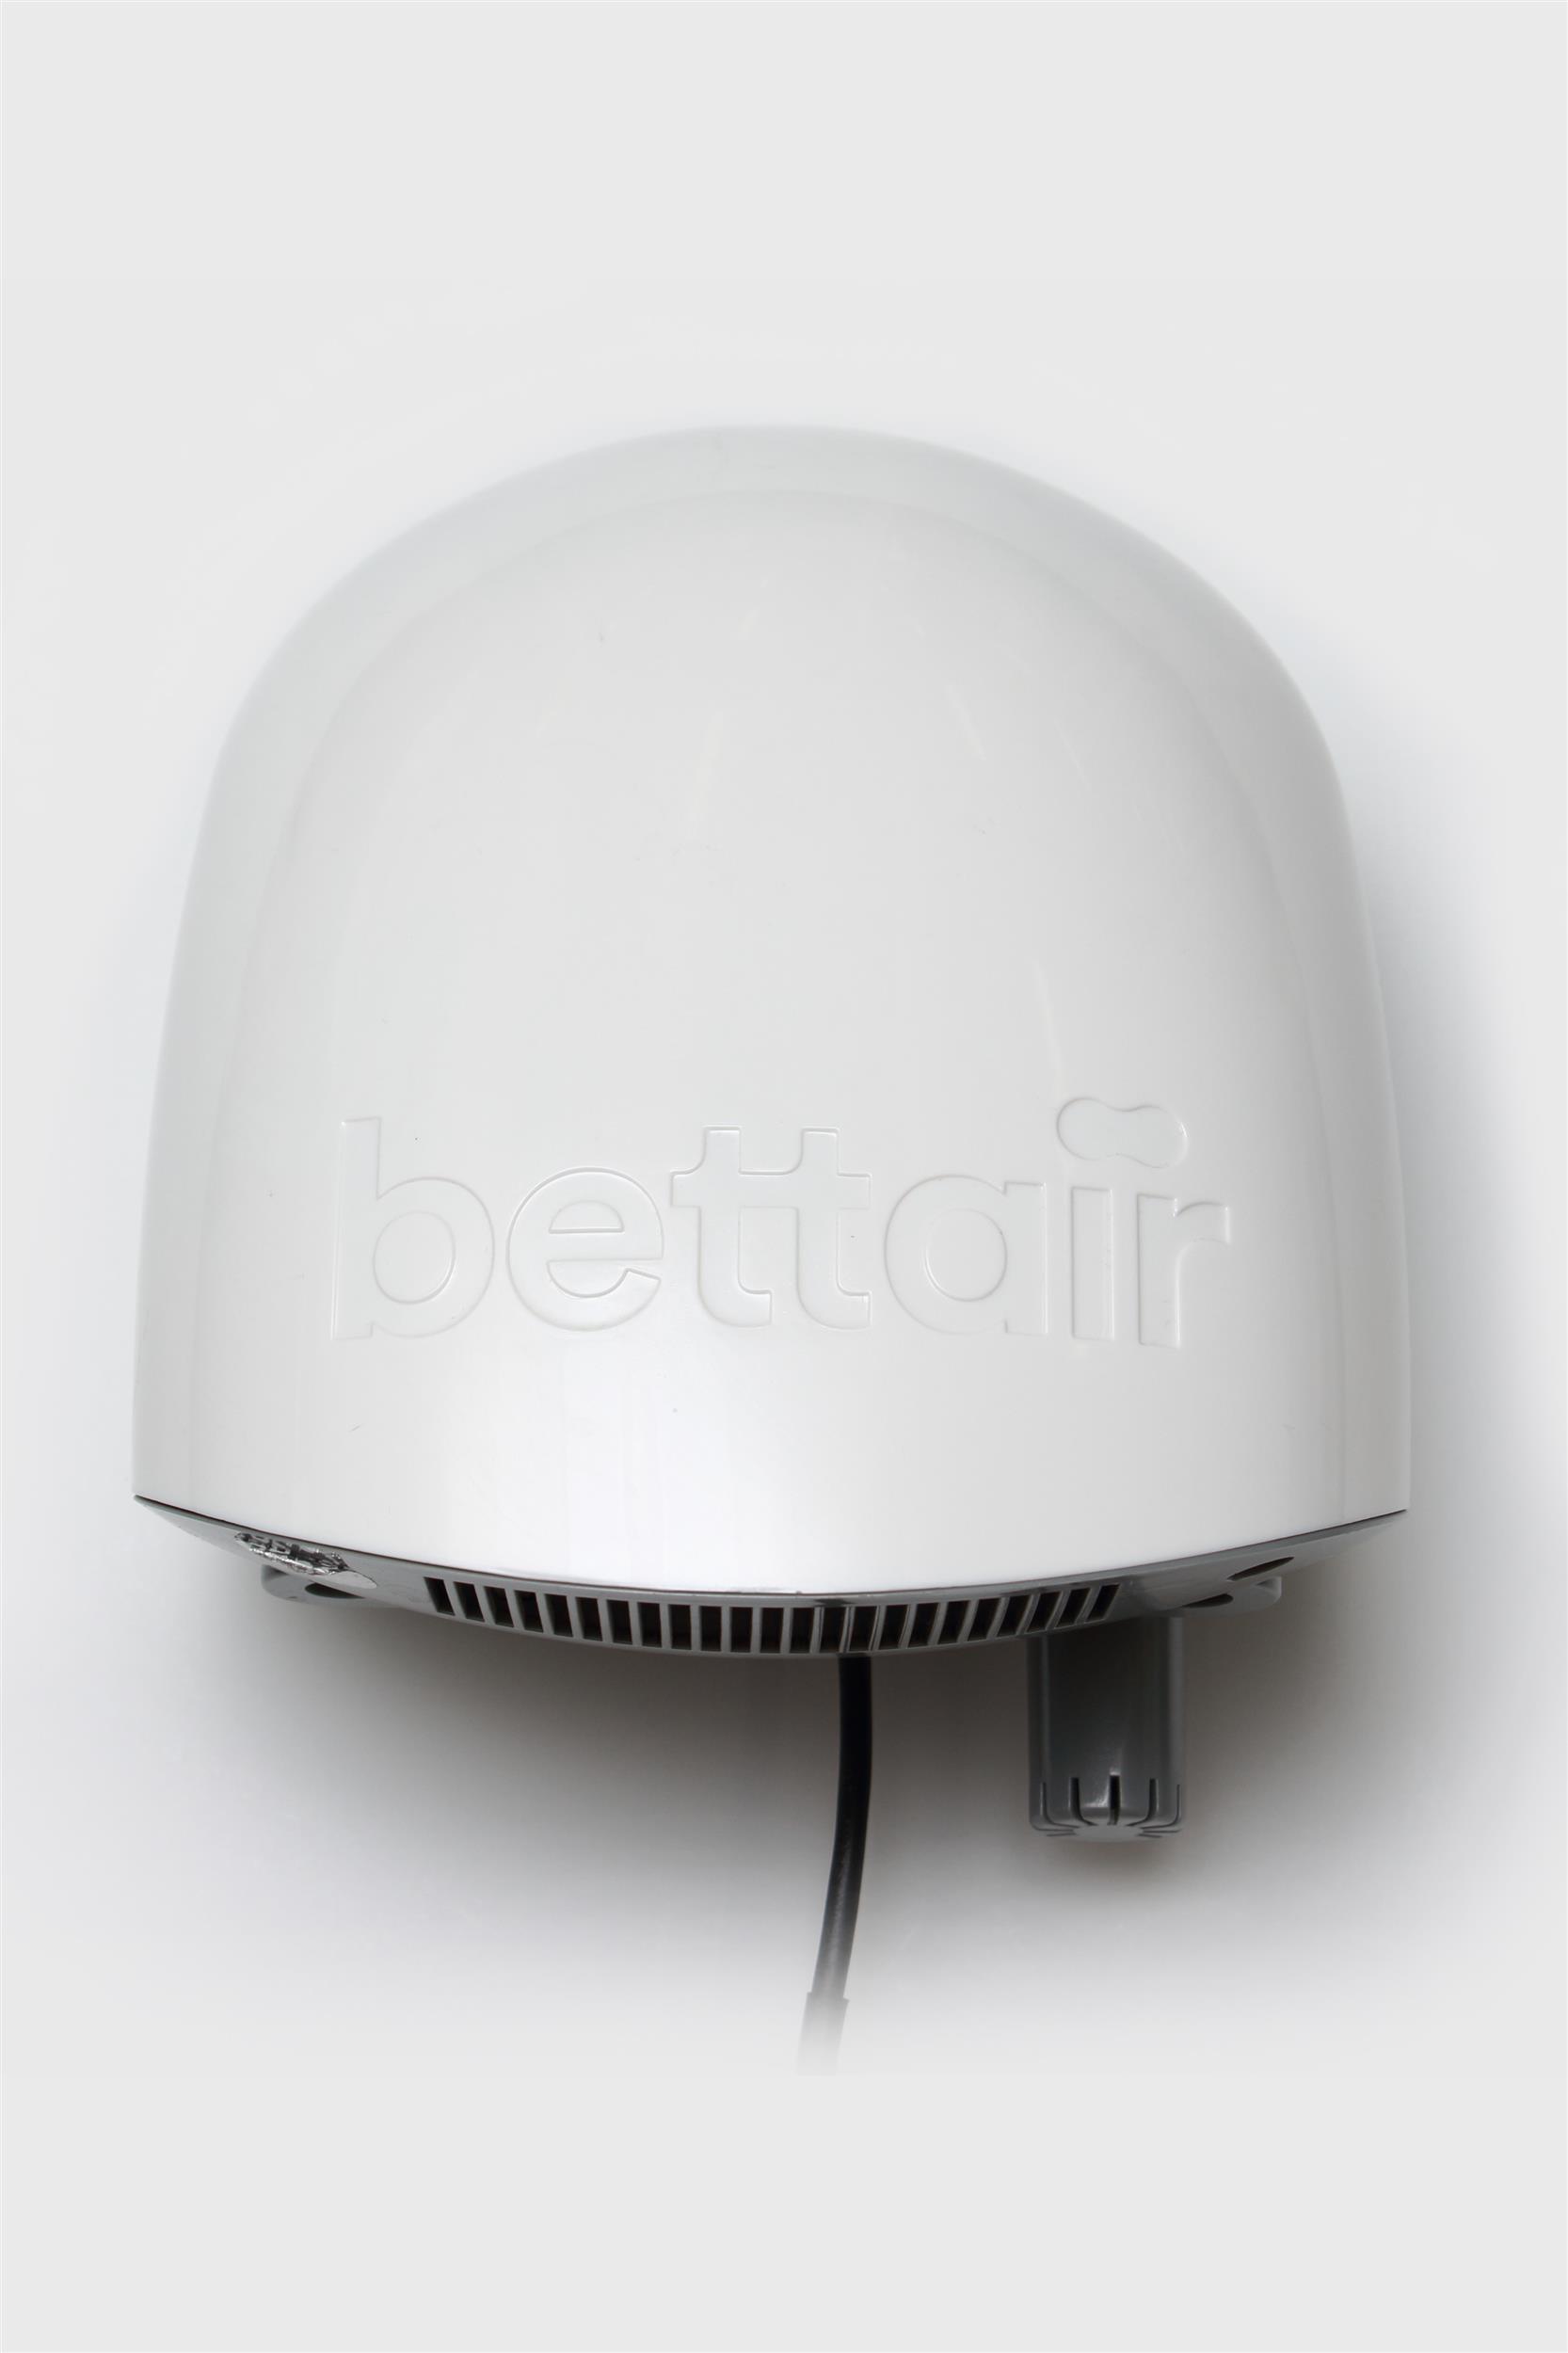 |
6330 |
PM1.0 |
0.59 to 0.65 |
2.9 to 3.3 |
- |
- |
Field
|
Bettair
(Static Node MK2 Series)
 |
6330 |
PM2.5 |
0.48 to 0.54 |
4.5 to 5.0 |
- |
- |
Field
|
Bettair
(Static Node MK2 Series)
 |
6330 |
PM10 |
0.13 to 0.17 |
13.7 to 14.9 |
- |
- |
Field
|
Bettair
(Static Node MK2 Series)
 |
6330 |
CO (EC) |
0.91 to 0.92 |
100 |
- |
- |
Field
|
Bettair
(Static Node MK2 Series)
 |
6330 |
NO (EC) |
0.92 to 0.95 |
3.3 to 4.3 |
- |
- |
Field
|
Bettair
(Static Node MK2 Series)
 |
6330 |
NO2 (EC) |
0.86 to 0.89 |
2.6 to 3.1 |
- |
- |
Field
|
Bettair
(Static Node MK2 Series)
 |
6330 |
O3 (EC) |
0.91 to 0.93 |
4.8 to 6.4 |
- |
- |
Field
|
IKEA
Vindstyrka
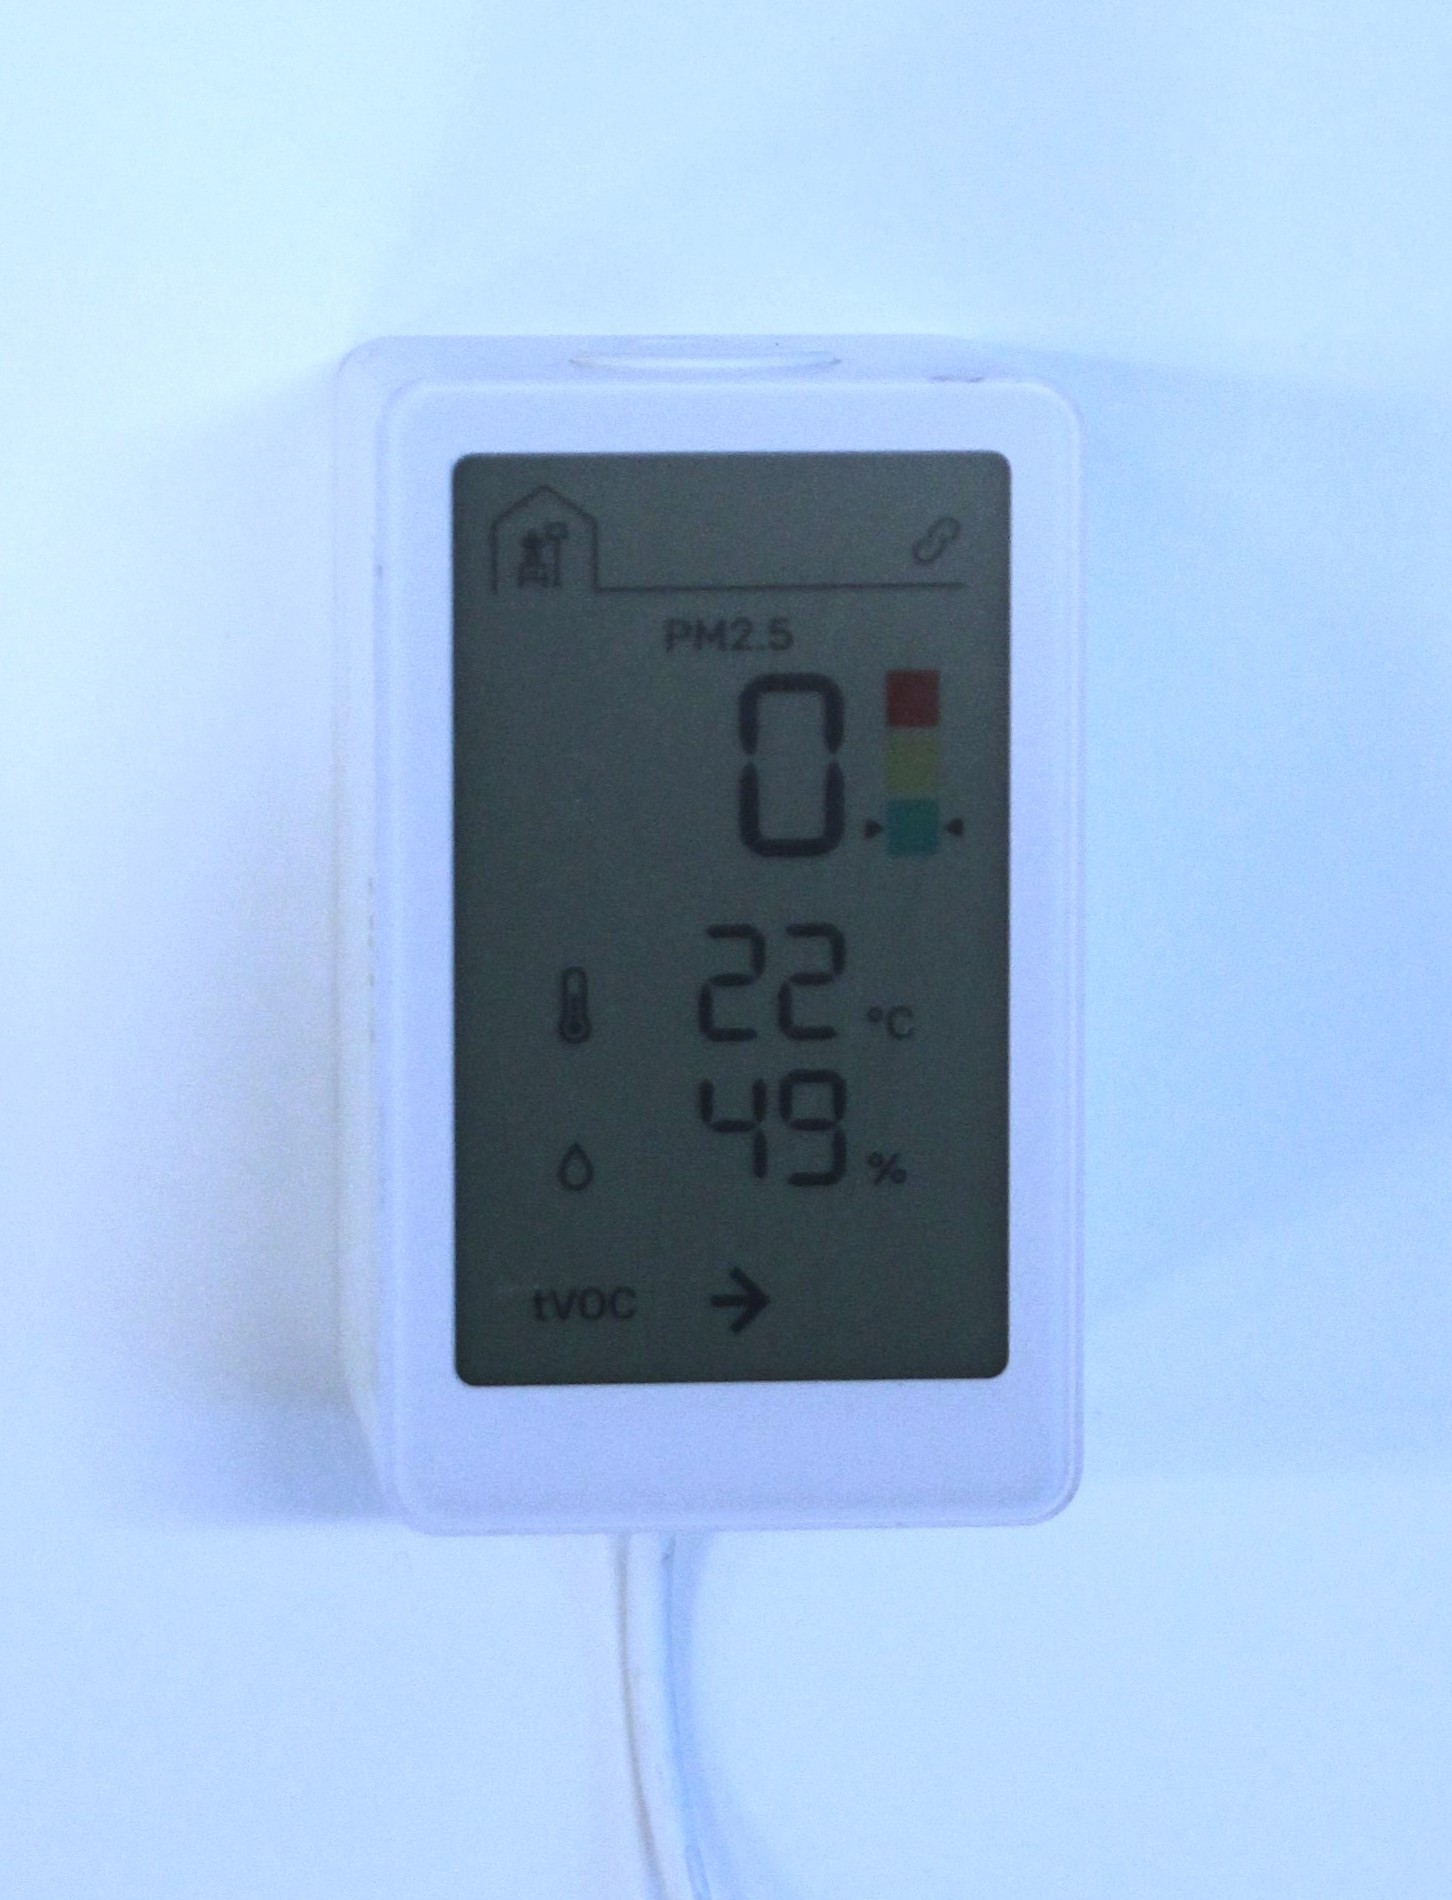 |
60 |
PM2.5 |
0.66 to 0.67 |
5.1 to 5.5 |
- |
- |
Field
|